Truck driver stress is a significant occupational challenge driven by tight delivery schedules, traffic congestion, parking shortages, and extended time away from home. While the trucking profession is highly rewarding and essential to the economy, the unique demands of the road can take a toll on a driver’s physical and mental well-being. This comprehensive guide breaks down the primary types of stress drivers experience on and off the road, why they occur, and practical, evidence-based ways to handle them.
By understanding the root causes of stress and applying realistic routines that fit within Federal Motor Carrier Safety Administration regulations, drivers can protect their health, improve their focus, and build a more resilient career in the transportation industry.
Is Truck Driving Stressful?
Yes, truck driving is stressful due to intense time pressure, heavy traffic, sleep disruption, social isolation, strict regulatory demands, and constant safety risks. However, this stress can be effectively managed with proactive trip planning, mindset skills, daily movement, and structured recovery strategies.
Truck driving is a profession that requires constant vigilance. The daily reality involves navigating a heavy commercial vehicle through unpredictable weather and dense urban traffic while adhering to strict Hours of Service regulations. Drivers frequently face detention time at shipper and receiver docks, which eats into their driving hours and creates anxiety about meeting delivery windows.
Beyond the immediate demands of driving, the lifestyle itself introduces unique stressors. Long-haul drivers spend weeks away from their families, leading to social isolation and loneliness. Finding a safe place to park at the end of a shift has become a daily source of anxiety, with the FMCSA noting that the ongoing nationwide truck parking shortage forces drivers to stop early or park in unauthorized areas.
Additionally, the challenge of maintaining a healthy diet and finding opportunities for exercise while living out of a cab contributes to physical stress. Despite these challenges, drivers who implement targeted routines, such as micro-breaks, breathing exercises, and pre-trip parking plans, can significantly lower their daily stress burden.
Why Being a Truck Driver is Stressful
Being a truck driver is stressful primarily due to the lifestyle demands, including long absences from home, limited access to healthy food and fitness facilities, and highly unpredictable daily schedules. However, many drivers balance this stress with the independence and pride of performing essential work.
When asking if being a truck driver is stressful, it is crucial to distinguish between the act of driving and the lifestyle of a driver. The acute stress of navigating a traffic jam or executing a tight backing maneuver is temporary. The chronic stress of the lifestyle is what often leads to burnout. Living in a space the size of a walk-in closet for weeks at a time creates friction. Finding nutritious food at a travel plaza is difficult, and the lack of physical activity takes a toll on the body.
The NIOSH reports that compared to U.S. adult workers, truck drivers have significantly higher rates of heart disease, diabetes, hypertension, and obesity. In fact, 7 in 10 long-haul truck drivers are obese, which is twice the rate of the general adult workforce. This physical reality compounds mental stress.
To mitigate these lifestyle stressors, successful drivers rely on rigorous cab organization and pre-planning. Packing a cooler with healthy meals, utilizing portable 12V cookware, and scheduling 10-to-15 minute bodyweight workouts during mandatory breaks can restore a sense of control. Furthermore, setting clear expectations with family regarding communication schedules helps bridge the gap of physical separation, reducing the emotional strain of the job.
What Causes Truck Drivers to Have Stress?
Truck driving is a stressful job because of systemic industry factors like shipper delays, severe parking scarcity, and dense traffic, combined with the cognitive load of constant situational awareness. It ranks higher in occupational stress than many other professions due to these environmental unpredictabilities.
Evaluating truck driving as a stressful job requires looking at the work design and systems that drivers operate within. Unlike an office worker who controls their immediate environment, a truck driver’s day is dictated by external forces. A delay at a receiver’s dock can ruin a carefully planned schedule, pushing a driver closer to their HOS limits. The FMCSA’s HOS rules permit up to 11 hours of driving within a 14-hour window, followed by a mandatory 10-hour break.
When delays consume the 14-hour clock, drivers are forced to race against time to find parking.
The cognitive demand of the job is immense. Operating a commercial motor vehicle requires continuous scanning, anticipating the actions of passenger vehicles, and adapting to rapidly changing weather. This constant vigilance drains mental energy. The FMCSA’s Large Truck Crash Causation Study reported that 13 percent of commercial motor vehicle drivers were considered fatigued at the time of their crash, highlighting the dangerous intersection of job stress and safety.
Drivers can counteract these systemic job stressors by increasing their personal job control. This involves negotiating realistic appointment windows with dispatch, utilizing vetted parking apps and state Department of Transportation resources to secure parking early, and relying on standardized checklists for pre-trip and post-trip inspections to reduce cognitive fatigue.
What is a Truck Driver’s Stress Level?
A truck driver’s stress level fluctuates daily, typically peaking during urban rush hours, adverse weather conditions, late-shift parking searches, or unexpected DOT inspections. Drivers can manage these peaks by tracking a daily stress scale and implementing proactive stabilization strategies.
Understanding your truck driver stress level requires paying attention to both physical and mental signals. Stress is not a constant; it spikes during specific, high-pressure events. A driver might start the day relaxed but experience a severe stress spike when caught in an unexpected snowstorm or when arriving at a designated truck stop only to find it completely full.
To prevent these spikes from accumulating into chronic burnout, drivers should establish a simple “stress dashboard” to check in with themselves daily. This self-assessment should include monitoring sleep quality over the past week, noting any muscle tension in the neck or lower back, evaluating current irritability or alertness, and tracking the frequency of near-misses on the road.
By recognizing when their stress level is rising, drivers can deploy immediate countermeasures. A pre-trip scan of weather radar and traffic density allows a driver to mentally prepare for the route ahead. Deciding on fallback parking sites, having a Plan A, Plan B, and Plan C, eliminates the panic of the end-of-shift scramble. Timeboxing meals, stretching, and calls home ensures that recovery happens systematically, rather than being left to chance.
How Can I Combat Stress As a Truck Driver?
Truck driving stress encompasses time pressure, traffic congestion, severe fatigue, social isolation, and physical pain. The most effective way to combat these stressors is by applying specific on-the-road countermeasures like buffer scheduling, alternate routing, and strict sleep hygiene.
To effectively manage truck driving stress, it is helpful to categorize the specific triggers and apply targeted solutions to each.
Time Pressure and Detention
The anxiety of a ticking HOS clock is a primary stressor. When a driver is detained at a facility for hours without pay, frustration mounts.
Solution: Build buffer time into your schedule. Communicate early with dispatch regarding check-in times and meticulously document all delays to ensure fair planning for the next leg of the trip.
Traffic, Weather, and Routing
Navigating a heavy vehicle through a sudden downpour or a major metropolitan traffic jam requires intense concentration and triggers a physical stress response.
Solution: Use state DOT alerts and weather radar to plan alternate routes before entering the cab. Adopt a defensive driving mindset, deliberately increasing following distance to give yourself more reaction time and reduce the need for sudden braking.
Sleep and Fatigue
The FMCSA notes that being awake for 18 hours produces impairment comparable to a blood alcohol concentration of 0.08 percent. Sleeping in a moving or noisy environment disrupts restorative rest.
Solution: Maintain a consistent sleep window whenever possible. Use blackout curtains, a sleep mask, and earplugs to optimize the sleeper berth environment. Implement a strict caffeine cutoff 6 to 8 hours before your planned sleep time.
Isolation and Mental Health
Weeks away from a support network can lead to depression and anxiety.
Solution: Schedule regular social calls with family or friends. Participate in positive driver communities and utilize Employee Assistance Programs or telehealth services when feeling overwhelmed.
Physical Strain and Pain
Sitting for 11 hours a day causes hip tightness, lower back pain, and shoulder tension.
Solution: Incorporate daily mobility routines targeting the hips and back. Ensure your seat is ergonomically adjusted with proper lumbar support to minimize vibration and impact.
What are some of the Challenges that Truck Drivers Face?
Truck driving is so stressful due to structural industry challenges: thin delivery margins, unpredictable loading times, severe parking shortages, and the constant need for situational awareness in a heavy vehicle. Addressing these root causes requires cooperation between drivers, carriers, and shippers.
When asking why truck driving is so stressful, one must look beyond the individual driver to the broader supply chain. The freight market operates on thin margins and just-in-time delivery models. Shippers and receivers demand precision, but often fail to provide the infrastructure, such as efficient docks or on-site overnight parking, to support the drivers meeting those demands.
The nationwide parking shortage is a structural crisis. When a driver must spend the last hour of their HOS clock anxiously searching for a safe place to park, the stress is immense.
Furthermore, the regulatory environment adds a layer of administrative burden. Managing Electronic Logging Devices, preparing for weigh station inspections, and ensuring compliance with complex rules requires constant mental bandwidth.
While drivers must manage their own reactions to these stressors, carriers and shippers play a crucial role in reducing them. Facilities that provide predictable loading windows, clear dock communication, and access to restrooms significantly lower driver anxiety. Carriers that implement driver-first policies, prioritizing safe parking, respecting rest periods, and maintaining open lines of communication, create an environment where stress is manageable rather than overwhelming.
What are the Signs of Physical and Mental Stress from Truck Driving?
The physical and mental stress from driving a truck manifests as increased heart rate, muscle tension, cumulative fatigue, irritability, and reduced focus. Recognizing warning signs like microsleeps or persistent headaches is critical for preventing accidents and managing long-term health.
The human body is not designed to sit in a vibrating seat, hyper-focused on a highway, for 11 hours a day. The physiological effects of this environment are profound. The constant vibration of the cab, the physical effort of shifting gears or steering, and the sustained adrenaline required to navigate traffic lead to elevated heart rates and chronic muscle tension. Over time, this physical toll merges with psychological strain, resulting in decision fatigue and a shortened temper.
Drivers must be hyper-aware of the warning signs that their stress and fatigue levels are entering the danger zone. The most critical red flag is the occurrence of microsleeps, brief, uncontrollable moments of sleep that last only a few seconds but can result in catastrophic lane drifting or near-misses. Other physical warning signs include persistent tension headaches, chronic lower back pain, and gastrointestinal issues stemming from poor diet and irregular schedules. Psychologically, drivers may experience withdrawal, persistent sadness, or a loss of interest in activities they usually enjoy.
When these symptoms persist or worsen, it is vital to seek professional help. Drivers should not hesitate to reach out to licensed clinicians, utilize company Employee Assistance Programs, or contact national crisis hotlines if they feel overwhelmed.
How Can I Overcome Stress as a Truck Driver?
To combat the daily stress of truck driving, professionals must adopt a structured toolkit that includes two-minute breathing resets, strategic microbreaks, strict sleep hygiene, and mindful attention techniques to maintain focus without burning out.
Managing the stress of truck driving requires more than just toughing it out; it requires a systematic approach to daily routines. By implementing a consistent on-the-road toolkit and prioritizing off-duty recovery, drivers can maintain their health and performance over the long haul.
The Daily On-the-Road Toolkit
Small interventions throughout the day prevent stress from compounding.
Breathing Resets: At every fuel stop or red light, practice box breathing (inhale for 4 seconds, hold for 4, exhale for 4, hold for 4) to downshift your heart rate and lower cortisol levels.
Microbreaks: Step out of the cab every 2 to 3 hours. Perform a five-move stretch routine during pre-trip and post-trip inspections to release tight hip flexors and shoulders.
Audio Environment: Curate your cab’s audio. Use upbeat playlists to fight afternoon slumps, and switch to calming audiobooks or podcasts when navigating stressful traffic.
Nutrition: Pack balanced snacks that hit protein, fiber, and hydration targets to prevent the energy crashes associated with heavy, carb-heavy truck stop meals.
Off-Duty Recovery and Mindset
How you recover dictates how you perform the next day.
Sleep Hygiene: Keep your sleeper berth cool and dark. Avoid heavy meals within two hours of sleep, and establish a screen curfew to allow your brain to wind down.
Mindset Skills: Practice “see, breathe, release” while scanning the horizon to maintain alertness without falling into anxious rumination.
When delayed at a dock, actively reframe the wait as a controlled pause, an opportunity to stretch, meal prep, or call home, rather than a frustrating waste of time.
Conclusion
Truck driver stress is a real, systemic challenge, but it is entirely manageable with the right approach. The physical demands, time pressures, and isolation of the road require drivers to treat their health and mental well-being with the same rigor they apply to their pre-trip inspections.
Start small: pick one or two strategies from this guide to implement today. Whether it is committing to a 10-minute stretch routine, setting a hard cutoff for caffeine, or establishing a firm Plan B for parking, these incremental changes compound over time.
Track your daily stress levels, adjust your habits as needed, and do not hesitate to consult professional resources or lean on your peers for support. By taking proactive control of your routines, you can protect your health, improve your safety, and build a sustainable, rewarding career on the open road.
FAQs
Q: What causes the most stress for truck drivers?
A: Common causes include intense time pressure, severe parking shortages, unpredictable traffic and weather, circadian sleep disruption, social isolation, strict compliance tasks, and financial uncertainty tied to variable miles.
Q: How do truck drivers deal with stress on long hauls?
A: Successful drivers manage long-haul stress by rigorously planning their routes and parking, maintaining a consistent sleep schedule, packing healthy meals, taking frequent microbreaks to stretch, and staying connected with family through scheduled calls.
Q: Is truck driving bad for mental health?
A: It can be unmanaged. The isolation, sleep deprivation, and high-pressure environment increase the risk of anxiety and depression. However, drivers who prioritize sleep hygiene, physical movement, and social connection can maintain strong mental health.
Q: How many hours can a truck driver legally drive in a day?
A: Under FMCSA rules, property-carrying drivers may drive a maximum of 11 hours after 10 consecutive hours off duty and must not drive beyond the 14th consecutive hour after coming on duty.
Q: What are the signs of driver burnout?
A: Signs of burnout include chronic exhaustion, frequent irritability or anger at dispatch and other drivers, reliance on heavy caffeine to stay awake, persistent physical pain, and a cynical or detached attitude toward the job.
Q: How can truck drivers sleep better on the road?
A: To improve in-cab sleep, maintain a consistent sleep window, use blackout curtains to darken the cab, wear earplugs and an eye mask, set a strict caffeine cutoff 6–8 hours before bed, and secure parking early to reduce pre-sleep anxiety.
Truck driver budget tips matter most when a good week can vanish under fuel spikes, surprise parking fees, and grab-and-go meals. This guide takes a practical route: everyday habits that cut costs on the road, paired with clear money planning at home.
You’ll learn how to plan fuel and stops, keep MPG honest, and apply per diem rules without drowning in receipts. We’ll translate revenue and expenses into a cost-per-mile you can track, then build a working money routine, weekly reconciles, monthly reviews, and quarterly tune-ups, that fits real freight cycles. For owner-operators, we’ll add a straightforward business rhythm so cash reserves, maintenance, and taxes stop being last-minute fires.
What Causes Truck Drivers to Overspend on the Road?
Truck drivers often overspend on the road due to a string of small, fast decisions made under delivery pressure. Frequent purchases like truck stop coffee, fast food, and paid parking quickly accumulate. Without a predefined weekly budget and in-cab meal plan, these small expenses create significant financial leaks.
Life on the road is a string of small, fast decisions, where to park, what to eat, when to shower, whether to grab a drink at the counter or refill your bottle. Those choices often come after long hours, at odd times, and under delivery pressure. Without a simple system, small spends stack up and blur your weekly totals.
Think of your spending as a route you can map. The goal is to control the routines that repeat every day and week, rather than trying to micromanage every purchase in the moment. Build a few guardrails that travel with you. Each one targets a predictable leak in your wallet:
A weekly money limit you can check quickly
A default plan for meals and drinks
Reliable cold storage so food stays safe
A habit of using free or low-cost amenities
Restocking from home instead of travel centers
Basic banking rules that avoid fees
Trip planning that reduces paid parking and fuel waste
Here’s why that matters. Most overspending doesn’t come from one big choice; it comes from dozens of $2–$15 decisions under time pressure. For example, two truck stop coffees and two bottled waters can quietly add up to $10–$12 a day. Brewing in-cab and refilling a jug brings that down to well under $2. A single hot meal from a counter may run $12–$20, while a reheated portion from your fridge can land closer to $4–$6.
Across a seven-day run, the difference becomes a clear line on your ledger. These comparisons aren’t about sacrifice; they’re about setting defaults that fit your schedule so you don’t rely on willpower when you’re tired and the easiest option is the most expensive one.
Unpredictable schedules add another wrinkle. Delays at docks, weather holds, and changing appointments can push you outside “normal” meals and stop times. That’s exactly when a system earns its keep. If your norms are clear, meals and drinks already in the cab, a fridge or cooler that holds at food-safe temperatures, a short list of terminals or partner stops with showers and laundry, and a pre-trip restock of staples, you can roll with changes without paying a premium. Think of it as pre-deciding the 80 percent you can control, so the 20 percent you can’t doesn’t wreck the week.
How Do You Build a Truck Driver Weekly Budget?
To build a successful truck driver weekly budget, you must separate fixed expenses from variable road costs. By matching your spending plan to your pay cadence and converting total dollars into a cents-per-mile target, you create a practical financial rhythm that guides daily choices at the pump and the counter.
A weekly budget that holds up under real miles is less about spreadsheets and more about rhythm. With those pieces in place, your money plan stops being abstract and starts guiding choices.
What is the Difference Between Fixed and Variable Trucking Costs?
Fixed trucking costs are recurring expenses that remain the same regardless of miles driven, such as insurance, phone bills, and subscriptions. Variable trucking costs fluctuate based on road activity, including meals, drinks, cab supplies, and occasional paid parking. Separating these categories is the first step in effective fleet budgeting.
Start by sorting fixed and variable costs. Put real numbers on paper. If your fixed bills run $520 a month, convert that to a weekly target so your plan lines up with your pay cadence: about $120 to $130 per week covers it without end-of-month crunch. If you’re paid weekly, fund those fixed amounts each payday. If you’re paid biweekly, move half-shares into a “bills” bucket each week so you never play catch-up.
How Can Drivers Cap On-the-Road Spending?
Drivers can cap on-the-road spending by setting a strict weekly limit for variable categories before leaving the driveway. A durable cap typically allocates specific dollar amounts for food, cab supplies, and discretionary items. Reviewing this running total daily prevents budget overruns and keeps your weekly financial plan on track.
With fixed covers, set a hard cap for the categories that swing the most. Treat it like your fuel budget for the body. For a company driver, a simple, durable cap might look like this:
$100 for food and drinks you’ll consume that week
$20 for cab supplies and hygiene
$40 for truly discretionary items
The exact dollars can change, but the discipline doesn’t. At the end of each day, take three minutes to check the running total in your bank app or notes. That small nightly review keeps a “weekly plan” from turning into a last-day surprise.
How Do You Calculate Spending in Cents per Mile?
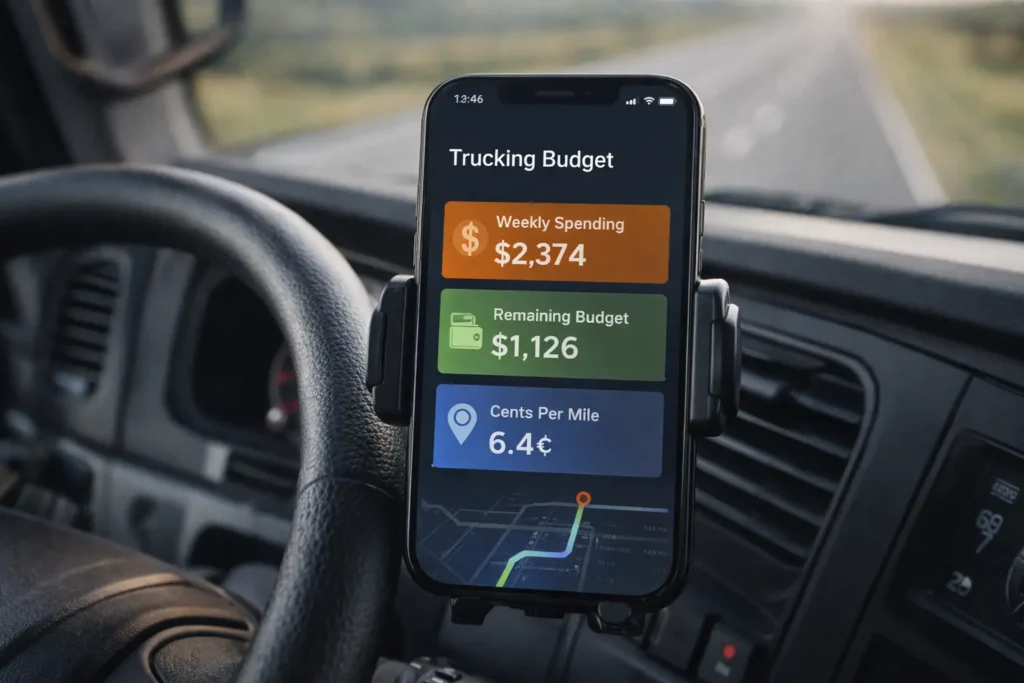
To calculate spending in cents per mile, divide your total weekly road-spend cap by your expected weekly mileage. For example, a $160 spending cap divided by a 2,500-mile week equals a personal spend rate of 6.4 cents per mile. This metric helps drivers visualize costs alongside fuel efficiency.
Now translate your cap into a per-mile lens so the budget speaks to how you actually earn. Run a heavier week at 2,800 miles with the same cap and you’re at 5.7 cents per mile.
That simple ratio makes costs visible the same way fuel MPG does. It also shows how small changes add up. Drop your effective spend from 6.4 to 4.8 cents per mile by tightening convenience buys, and on a 2,500-mile week you keep about $40. Do that for 50 working weeks and you’ve kept roughly $2,000 that used to slip through cashiers’ hands.
What is the Best Way to Align Cash Flow With Paydays?
The best way to align cash flow with paydays is to schedule fixed-bill and savings transfers to leave your checking account on the exact day your deposit lands. Whether paid weekly or biweekly, moving proportional shares immediately ensures essential costs are covered before variable spending occurs.
Tie the framework to your pay rhythm so cash flow feels smooth instead of lumpy. Consistency matters more than perfect math: the money for bills and savings goes first, and what’s left is what you have for the week’s variable spending.
How Can Truck Drivers Automate Savings?
Truck drivers can automate savings by automatically directing a set percentage of their net pay into separate short-term and long-term reserve accounts. Starting with a 10 percent allocation via direct deposit splits ensures consistent savings growth during busy freight cycles and provides a critical financial cushion during slow periods.
Make savings automatic and proportional so every check strengthens your footing. Skim a set percentage of net pay into two separate buckets: a short-term cushion you can tap for small repairs or a gap week, and a longer-term reserve you don’t touch. Bump to 12–15 percent when you can. Direct deposit splits or an immediate same-day transfer keep this honest. Treat this percent-to-savings as a fixed cost in your weekly plan.
What Should a Truck Driver Budget Dashboard Include?
A truck driver budget dashboard should include three key metrics: the fixed weekly amount already funded, the current week’s variable spending cap alongside the running tally, and the target cents-per-mile rate. This quick-glance system allows drivers to monitor and adjust their spending in real time from the cab.
Give yourself a quick dashboard you can see at a glance:
Fixed weekly amount funded
This week’s variable cap and current tally
Target cents per mile
That’s enough to steer decisions in real time. If you’re halfway through the week and halfway through your cap with more miles than expected, you’re on track. If your spend is outpacing miles, you know where to tighten. The point isn’t perfection, it’s control you can maintain from a driver seat, rest area, or fuel island.
This framework is the backbone of practical truck driver budget tips: protect the fixed, cap the variable, tie it to your pay, and translate it to cents per mile so it travels with you. With targets set, the biggest and most predictable wins come from how you handle meals.
How Can Truck Stop Loyalty Programs Save Money?
Truck stop loyalty programs save money by converting fuel purchases into high-value rewards like free showers and meals. By concentrating fueling within one or two national travel networks, drivers accumulate shower credits and points faster. Redeeming these credits for premium services significantly reduces out-of-pocket road expenses.
A loyalty-first approach keeps you on route while trimming out-of-pocket costs. Redemption value is the difference-maker: using points on low-cost snacks often returns a fraction of a cent per point, while redeeming a shower credit delivers far higher value in the double-digit dollar range.
Tips to maximize loyalty value:
Concentrate fuel purchases within one or two networks to earn credits faster.
Treat shower credits as high-value redemptions; avoid spending points on low-return items.
Track point expiration dates and cycle redemptions regularly.
Link your loyalty account in your fueling app to capture every eligible transaction.
How Does Route Geography Impact Budgeting?
Route geography impacts budgeting by dictating the cost-effectiveness of detours for amenities. While a 20-mile detour in a rural area may be smooth and low-stress, the same detour near a congested metro area can burn valuable time, waste fuel, risk missed parking, and ultimately negate any amenity savings.
Driver type and network access change the calculus. Company drivers with dense terminal coverage can plan a two- to three-day rhythm that clusters showers, laundry, and resupply in one stop, minimizing detours and maximizing free services. Owner-operators running diverse lanes may have fewer terminal options; for them, loyalty programs and selective use of independent facilities are primary tools, with terminals as opportunistic wins.
Use a quick decision check before detouring:
Estimate the detour cost (fuel plus time).
Tally expected amenity savings on that stop.
Confirm the detour will not jeopardize parking or appointment times.
Proceed only if the savings clearly exceed costs and risk is low.
What is the Best Weekly Route Plan for Budgeting?
The best weekly route plan for budgeting blends periodic terminal stops for consolidated needs with strategic fuel network loyalty. By banking shower credits and reserving points for high-value redemptions between terminal visits, drivers minimize detours and maximize free amenities, resulting in reliable, compounded monthly savings.
The most resilient approach blends both paths. Plan periodic terminal stops when they align with your route and consolidate multiple needs on the same visit. Between those stops, funnel fuel purchases through one or two networks. Track your actual spend for a month, showers, laundry, and late parking, to spot patterns, then tighten the plan where it matters.
Handled well, these small decisions translate into reliable monthly savings and support the broader truck driver budget tips that keep more of each check working for you.
How Do You Plan Budget-Friendly In-Cab Meals?
Planning budget-friendly in-cab meals requires aligning your menu with your truck’s actual cold storage limits, power inverter capacity, and daily schedule. By prepping portion-controlled, microwave-ready meals and rotating shelf-stable sides, drivers can avoid food spoilage, prevent tripped breakers, and eliminate the need for expensive last-minute truck stop dinners.
A solid in-cab meal plan can cut costs and stress, but a few common missteps can leave you with spoiled food, tripped breakers, or last-minute truck stop dinners. Spot these pitfalls early and use the fixes below to keep meals safe, quick, and affordable on any lane.
How Do You Prevent Food Spoilage in a Truck Fridge?
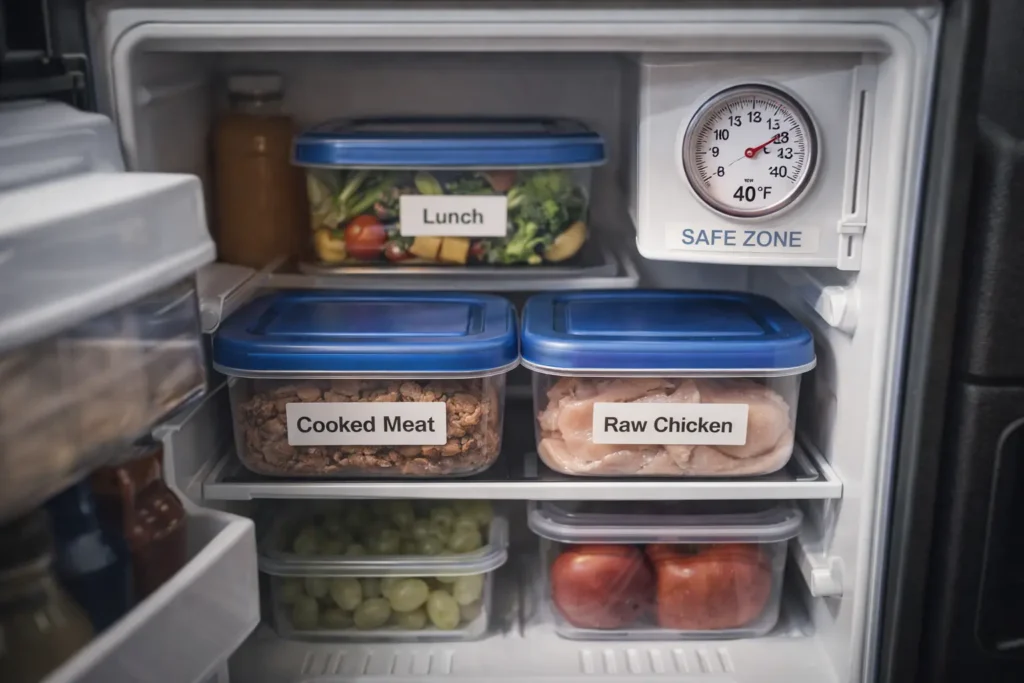
To prevent food spoilage in a truck fridge, avoid overpacking, which blocks airflow and raises temperatures. Plan a 3-to-4 day rotation for perishables, keep a thermometer to ensure temperatures stay below 40°F, store raw proteins in leakproof containers on the lowest shelf, and utilize shelf-stable sides to save space.
Bringing a week’s worth of fresh meat and dairy into a small fridge or thermoelectric cooler overwhelms capacity, pushing temps above safe levels and causing mid-week spoilage. This happens when planning by days instead of by cold storage limits.
Fix it:
Plan a 3–4 day rotation for perishables and freeze the rest.
Keep a fridge thermometer in the warmest spot and hold 40°F or below.
Store raw proteins on the lowest shelf in leakproof containers.
Use shelf-stable sides, rice, tortillas, canned vegetables, to extend meals without crowding cold space.
What Are the Best Quick Meals for 30-Minute Breaks?
The best quick meals for 30-minute DOT breaks are pre-portioned, microwave-safe dishes that reheat in under 10 minutes. Foods that handle reheating well, such as chili, pulled chicken, taco meat, and pasta bakes, paired with instant sides, ensure drivers can eat quickly without resorting to expensive fast food.
Meals that need chopping or long cook times don’t fit within Hours of Service realities, so you skip eating or grab fast food when the clock is tight. The issue often comes from batch cooking that isn’t portioned for quick reheat.
Fix it:
Pre-portion single servings (about 12–16 oz) in shallow, microwave-safe containers so they reheat in under 10 minutes.
Favorite dishes that handle reheat well: chili, pulled chicken, taco meat, pasta bake.
Pair mains with quick sides like bagged salad, instant rice, or tortillas.
Keep one “emergency” shelf-stable meal for nights when parking is tight.
How Do You Match Appliance Wattage in a Truck?
To match appliance wattage in a truck, verify that your cooking device’s power requirement is lower than your inverter’s maximum continuous rating. Using 12V cookers or low-wattage appliances (600–700W), running one device at a time, and keeping the engine running during use prevents tripped breakers and dead batteries.
Plugging a high-watt microwave, hot plate, or kettle into an undersized inverter, or running multiple devices at once, can pop fuses or leave you with a no-start. This usually comes from not checking wattage or carrier power policies.
Fix it:
Match appliance wattage to your inverter rating and use one device at a time.
Prefer 12V cookers or lower-watt options (around 600–700W) when allowed.
Keep cords short, use fused outlets, and avoid running high-draw gear on battery alone.
Follow carrier guidance on when the engine must be running for certain appliances.
What Are the Best Food Containers for Truck Drivers?
The best food containers for truck drivers are single-serve, freezer-grade, screw-top containers. Unlike bulk family-size containers, these prevent spills while the truck is in motion, cool down quickly to maintain food safety, and ensure even reheating in small in-cab microwaves, reducing food waste and frustration.
Bulk containers cool slowly (unsafe), spill in motion, and reheat unevenly, frustrating enough to push you toward a drive-thru. The problem starts when saving prep time takes priority over road-worthy packaging.
Fix it:
Portion meals into single-serve, freezer-grade, screw-top containers and label with item and date.
Cool cooked foods in shallow containers before refrigeration.
Pack sauces and dressings separately; add during reheat to preserve texture and flavor.
How Can Truck Drivers Maintain Food Safety?
Truck drivers can maintain food safety by following USDA guidelines: keeping cold foods strictly at or below 40°F and reheating leftovers to an internal temperature of 165°F. Using an instant-read thermometer, thawing food in the fridge rather than on the counter, and carrying sanitizing wipes significantly reduces bacteria risks.
Improper thawing and lukewarm reheating invite bacteria growth. This is common when drivers rely on time guesses instead of temperatures.
Fix it:
Follow USDA guidance: keep cold foods at 40°F or below; reheat leftovers to 165°F internal.
Thaw in the fridge, not on the counter. When pressed for time, use a microwave’s defrost setting and cook immediately.
Carry an instant-read thermometer and sanitizing wipes.
Keep raw and ready-to-eat items strictly separated.
How Do You Avoid Taste Fatigue with In-Cab Meals?
To avoid taste fatigue with in-cab meals, use a mix-and-match strategy rotating three proteins and three bases. Packing a small spice kit, carrying versatile sauces like salsa or teriyaki, and incorporating varying textures like crunchy slaw or roasted vegetables prevents boredom and reduces the temptation to buy truck stop dinners.
Eating the same two meals repeatedly leads to boredom and last-minute truck stop dinners. Menus often lack variety in sauces, textures, or proteins.
Fix it:
Use a 3×3 mix-and-match: three proteins (chicken, beef, beans) × three bases (rice, tortillas, pasta).
Pack a small spice kit and two versatile sauces (for example, salsa and teriyaki).
Rotate textures: crunchy slaw, roasted vegetables, fresh herbs.
Schedule one planned treat meal within budget to help you stay consistent the rest of the week.
Avoiding these specific errors keeps food safe, meals fast, and spending predictable, exactly what effective truck driver budget tips aim to deliver. Dial in the small details now to cut waste and curb impulse buys without giving up good meals.
How Can Trip Planning Cut Fuel and Parking Costs?
Trip planning cuts fuel and parking costs by prioritizing efficiency over maximum speed. By setting steady target speeds to improve aerodynamics, planning earlier start times to secure free parking before peak congestion, and aligning required DOT breaks with meal windows, drivers can significantly reduce fuel burn and avoid nightly parking fees.
Many drivers are taught that trip planning is mostly about routing and arrival times, and that the fastest day is the most profitable. The idea is simple: push a little harder, roll a little faster, and you’ll get ahead of schedule and ahead on money. Costs are treated as fixed background noise you can’t influence.
Does Driving Faster Increase Trucking Profits?
Driving faster rarely increases trucking profits because aerodynamic drag rises sharply with speed, drastically reducing fuel efficiency. “Making up time” often trades minutes for dollars. Furthermore, arriving late in crowded areas increases the likelihood of circling for parking or paying premium fees, adding stress and burning extra fuel.
That mindset misses where profit actually leaks: extra fuel burned by higher speeds and idling, last-minute parking fees, and out-of-route scrambles that add time and miles.
How Much Fuel Can You Save by Reducing Speed?
Reducing a heavy-duty truck’s speed by just 2 to 3 mph can improve fuel efficiency by 0.2 to 0.5 MPG. Over a 2,500-mile week, increasing efficiency from 7.0 to 7.3 MPG saves approximately 15 to 24 gallons of fuel, equating to $60 to $95 in savings at $4 per gallon.
Research and fleet data point to simple habits that pay off without missing appointments when start times and breaks are planned.
Modest speed discipline helps. Shaving just 2–3 mph can improve heavy-duty mpg by roughly 0.2–0.5, depending on truck and terrain.
Over a 2,500-mile week, moving from 7.0 to 7.3–7.5 mpg saves about 15–24 gallons, roughly $60–$95 at $4 diesel.
Idling typically burns 0.6–1.0 gallons per hour. Cutting one hour a day by staging earlier, parking in shade, and using a bunk heater can save about $15–$25 a week.
One paid parking night at $20–$25 each week adds up to $80–$100 a month, often avoidable with earlier reservations or routing through terminals.
What Are the Best Trip Planning Practices for Cost Control?
The best trip planning practices for cost control involve setting steady target speeds suited to terrain and weather, starting shifts earlier to secure free parking, and aligning DOT breaks with meal windows to minimize extra stops and idling. Reserving parking in known hot spots also prevents costly late-day scrambling.
Reframe trip planning as profit control, not just an ETA exercise. Build a plan that reduces waste before it starts.
Set a steady target speed that fits terrain, weather, and appointment windows.
Start earlier to secure parking before peak evening congestion.
Align required breaks with meal or cooking windows to reduce extra stops and idling.
Reserve parking when entering known hot spots, or route through company terminals when available.
Avoid late-day dead-ends that force fees or long backtracks; leave flexible options for your last leg.
What is the Payoff of Cost-Focused Trip Planning?
The payoff of cost-focused trip planning is a quieter, more predictable work week with significantly lower operating expenses. By spending less on fuel, avoiding surprise parking charges, and keeping miles highly productive, drivers generate compounding financial returns run after run while experiencing less daily stress.
When trip planning focuses on cost control as much as timing, your weeks get quieter and more predictable. You spend less on fuel, avoid surprise parking charges, and keep miles productive, the kind of practical truck driver budget tips that compound run after run.
Why is a Budget System Critical for Freight Markets?
A structured budget system is critical for freight markets because it creates financial predictability in a job defined by variables like fuel prices, weather, and spot rates. Drivers who consistently control small daily costs build financial buffers that buy them flexibility and options when the freight market inevitably tightens.
When you zoom out, this guide isn’t just about trimming a few dollars from meals or coffee. It’s a method for creating predictability.
How is the Trucking Industry Changing in 2026?
In 2026, the trucking industry is seeing increased fuel volatility, an expansion of paid parking with dynamic pricing, and a consolidation of travel center loyalty ecosystems. To navigate these changes profitably, drivers must adopt structured route planning, maximize high-value point redemptions, and rely heavily on home-based resupply strategies.
Fuel will remain the most volatile line item for owner-operators, with regional swings that can change your weekly math overnight. Paid parking continues to expand as free spots lag demand, and more locations use dynamic pricing as the evening fills. At the same time, carriers and large networks are consolidating loyalty ecosystems and app tools, making route planning and points redemption more structured, and more workable if you think like an operator.
In that environment, the habits you’ve built aren’t just frugal moves; they’re a buffer that widens your profit lane when inputs shift:
Home-based resupply
In-cab meals
Points used on high-value redemptions
Fee avoidance
How Does Budget Clarity Improve Trucking Decisions?
Budget clarity improves trucking decisions by revealing a driver’s true cost per day. Company drivers with lower out-of-pocket costs can run longer with less stress, while owner-operators who understand their exact cost-per-mile can confidently pass on underpriced loads instead of taking unprofitable miles that merely wear out equipment.
When your personal and on-the-road spending is stable and tracked weekly, you know your true floor, the cost per day you must cover, the cash you need in reserves for maintenance and taxes, and the tradeoffs built into route and speed choices. That clarity changes decisions. In both cases, you move from reactive to deliberate.
How Can ELD Data Improve Your Trucking Budget?
ELD data, fuel receipts, and parking reservations create a living record of spending patterns that can improve your trucking budget. By treating this data as a feedback loop, drivers can identify expensive lanes, find terminals that consistently deliver value, and optimize meal times to align with free parking windows.
Technology is quietly amplifying the advantage of discipline. Treated as a feedback loop, not digital clutter, those patterns reveal lanes where you overspend, stores and terminals that consistently deliver value, and days when cooking during a 30-minute break lines up with parking windows. This isn’t about micromanaging every choice; it’s about letting data confirm which habits do the most work so you can double down on them. Over a quarter, that can be the difference between funding tire accruals from cash flow or leaning on credit.
How Does a Budget Build Resilience in Trucking?
A strong budget builds resilience in trucking by ensuring drivers can maintain healthy habits, like eating well in-cab and utilizing terminal amenities, even during market dips or weather delays. This financial stability supports steady energy, reduces decision fatigue, protects on-time performance, and ultimately safeguards long-term earning power.
A driver who can eat well in-cab, stretch water and coffee supplies, and tap terminals for showers and laundry can keep moving during weather delays, market dips, or equipment hiccups without stacking new costs onto a bad week. That resilience supports safety and health, fewer rushed stops, steadier energy, and less decision fatigue, which, in turn, protects on-time performance and earning power. In short, these truck driver budget tips aren’t small; they’re the scaffolding for a steadier career in a cyclical business.
FAQs
Q: What are the best truck driver budget tips for saving money on the road? A: The best truck driver budget tips include setting a weekly spending limit, planning in-cab meals, using loyalty programs for fuel and showers, tracking expenses daily, and converting spending into cents per mile to stay aligned with income.
Q: How do owner operators manage trucking expenses effectively? A: Owner operators manage trucking expenses by separating fixed and variable costs, aligning cash flow with paydays, automating savings, and tracking cost per mile to ensure profitability on every load.
Q: What are common owner operator trucking expenses? A: Common owner operator trucking expenses include fuel, maintenance, insurance, truck payments, food, parking, and cab supplies. These costs can vary weekly and should be carefully tracked to avoid overspending.
Q: How much does it cost to be an owner operator truck driver? A: The cost of being an owner operator varies, but major expenses include fuel, insurance, maintenance, and equipment payments. Weekly operating costs can fluctuate significantly depending on miles driven and fuel prices.
Q: How can truck drivers create a weekly budget? A: Truck drivers can create a weekly budget by calculating fixed expenses, setting a cap for variable spending, and dividing total costs by expected miles to determine a cents-per-mile budget target.
Q: What is the difference between fixed and variable trucking expenses? A: Fixed expenses remain consistent each month, such as insurance and phone bills, while variable expenses fluctuate based on driving activity, including food, fuel, and parking.
Semi truck maintenance isn’t just another line item, it’s one of the largest and most constant expenses in any trucking operation, and it directly determines whether your business stays on the road or sits idle. Every mile adds wear, every load adds strain, and every overlooked issue risks turning into costly downtime or a serious safety hazard. For owner-operators especially, maintenance isn’t optional or occasional, it’s the backbone of profitability, compliance, and long-term equipment value.
This guide breaks down the full maintenance landscape system by system, giving you a clear view of what it actually costs to keep a semi truck in top condition. From engine and transmission work to tires, brakes, and preventive service, we’ll outline realistic price ranges based on real-world scenarios, not just best-case estimates. The goal is to remove guesswork so you can anticipate expenses instead of reacting to them.
By the end, you’ll have more than just a list of repairs, you’ll walk away with a cost-aware maintenance checklist and a practical budgeting framework designed specifically for semi truck maintenance. Whether you’re planning for the year ahead or tightening margins in a tough market, this will help you stay compliant, avoid surprises, and keep your truck earning instead of parked.
The Cost Anatomy of Semi Truck Maintenance
The true cost of semi truck maintenance isn’t defined by a single repair, it’s shaped by a combination of variables that can swing the price of the exact same job by thousands of dollars. Understanding these cost drivers is what separates reactive spending from strategic budgeting.
First, age and mileage play a major role. A newer truck running under warranty may only need routine service, while a high-mileage unit (500,000+ miles) is far more likely to face major component replacements like injectors, turbochargers, or even an engine overhaul. Closely tied to this duty cycle, a truck hauling heavy loads daily or operating in stop-and-go conditions will wear components much faster than one running steady highway miles.
Your routes and climate matter more than most operators realize. Mountain driving increases strain on brakes and transmissions, while extreme heat accelerates tire wear and cooling system issues. Cold climates, on the other hand, can impact batteries, fuel systems, and startup reliability. Two identical trucks operating in different regions can have dramatically different maintenance profiles.
Then there’s the external pressure of parts inflation and supply chain variability. The cost of critical components, like DEF sensors, EGR valves, or brake assemblies, has fluctuated significantly in recent years. Pair that with rising shop labor rates, and repair bills can escalate quickly. Labor rates now commonly range from $110 to $180 per hour, depending on region and shop type, with metropolitan areas often at the higher end.
To make sense of these variables, it helps to shift your mindset from one-off repair costs to performance metrics like cents per mile and labor cost per hour. According to the American Transportation Research Institute, maintenance and repair costs typically fall in the range of ~15 to 20 cents per mile, though older equipment or severe-duty operations can push that even higher.
Here’s how that translates into a practical annual budget:
At 100,000 miles/year → $15,000 to $20,000 in maintenance
At 120,000 miles/year → $18,000 to $24,000 in maintenance
These figures include both preventive maintenance (oil changes, inspections, tires) and unexpected repairs. When labor is factored in, especially for major jobs requiring 10–40 hours, the total cost can climb rapidly.
The key takeaway is that semi truck maintenance isn’t random, it’s measurable and predictable when broken down correctly. By understanding your truck’s operating conditions and tracking costs in CPM, you can build a realistic annual budget, identify trends early, and avoid the financial shock of unplanned downtime.
Preventive Maintenance Schedules, Fluids, and Filters
Preventive maintenance is where smart operators win, or lose, money. Staying on schedule keeps small, predictable costs from turning into major, high-dollar failures. Most fleets and owner-operators follow a tiered system, PM A, PM B, and PM C, each building on the last with deeper inspections and service intervals.
PM A: Frequent, Foundational Service
Typical interval: Every 10,000–20,000 miles
Estimated cost: $300–$600
This is your most common service and the backbone of engine health: engine oil and filter change, chassis lubrication, fluid level top-offs, and a basic safety inspection (lights, hoses, belts). PM A keeps your engine protected and catches early wear before it escalates.
PM B: Intermediate Inspection & Replacement
Typical interval: Every 20,000–40,000 miles
Estimated cost: $500–$900
Includes everything in PM A, plus fuel filter replacement, air filter inspection/replacement, brake inspection and adjustment, battery and charging system check, and a more detailed undercarriage inspection. PM B goes beyond fluids, it’s about identifying wear patterns and preventing system failures.
PM C: Comprehensive Service
Typical interval: Every 60,000–100,000 miles
Estimated cost: $900–$1,500
This is your deep-dive service: all PM A + PM B items, full system diagnostics, driveline inspection and adjustments, wheel-end checks, alignment checks, and preventive component replacements as needed. PM C is where you reset the truck’s baseline condition and prevent catastrophic failures.
Key Fluid Services (Often Overlooked)
Fluids are the lifeblood of your truck, and skipping these services is one of the fastest ways to turn routine maintenance into major repairs. Coolant flushes typically run $200–$400 and help prevent overheating, corrosion, and liner pitting. Transmission service generally costs $250–$500, while differential service falls in a similar $250–$500 range, both critical for preventing gear wear and drivetrain failure.
Mini Cost Snapshot
PM A: $300–$600 (every 10k–20k miles)
PM B: $500–$900 (every 20k–40k miles)
PM C: $900–$1,500 (every 60k–100k miles)
Coolant Flush: $200–$400
Transmission Service: $250–$500
Differential Service: $250–$500
OEM Intervals & Oil Types
Keep in mind that intervals can vary significantly based on OEM recommendations and oil type. Trucks running standard oil typically stick to shorter intervals (around 15,000 miles), while long-drain synthetic oils, paired with proper filtration and oil analysis, can safely extend intervals to 25,000 miles or more. However, extended intervals only work when supported by consistent monitoring; otherwise, they can increase long-term wear.
Consistent PM is one of the highest-ROI decisions you can make. Spending a few hundred dollars on schedule can save you thousands in engine, transmission, or aftertreatment repairs, and keep your truck generating revenue instead of sitting in the shop.
Tires, Alignment, and Suspension Geometry
Tires are one of the most visible, and volatile, cost centers in semi truck maintenance. Unlike many components, they wear continuously, are directly impacted by driving conditions, and can quietly drain profits through poor fuel economy or uneven wear. Understanding tire economics means looking beyond purchase price and focusing on total cost of ownership.
Core Tire Costs (Per Unit & Service)
Steer tires: $350–$700 each
Drive tires: $300–$600 each
Full set replacement: $3,000–$6,000
Repair/patch: $30–$50
Balancing/alignment: $200–$350
Recaps (retreads): $150–$250 per tire
Steer tires typically demand premium pricing because they impact handling and safety, while drive tires offer more flexibility, this is where recaps often make the most economic sense. Recaps are commonly used on drive axles for long-haul operations where road conditions are consistent and predictable. However, they’re less ideal for steer positions or severe-duty routes (construction, off-road, sharp debris exposure) where failure risk is higher.
The Hidden Multiplier: Alignment & Suspension
Tires don’t wear in isolation, alignment and suspension geometry directly control how fast your tire investment disappears. Misalignment can scrub thousands of miles off a tire’s life, while worn suspension components quietly compound the problem. Key components and typical costs include shocks ($150–$300 each), bushings ($150–$300 per set/location), and airbags ($200–$400 each).
When these parts wear out, they cause uneven tire contact with the road, leading to irregular wear patterns like cupping, feathering, or edge wear. That not only shortens tire life but also increases rolling resistance, which reduces fuel efficiency. Even a small alignment issue can cost you 1–3% in fuel economy, adding thousands in annual fuel spend.
Tire Reserve: Cost Per Mile Strategy
To avoid large, unpredictable expenses, many operators budget tires using a per-mile reserve of about 3 to 6 cents per mile. At 100,000 miles per year, that translates to roughly $3,000–$6,000 annually dedicated to tires, aligning closely with real-world replacement costs depending on conditions and maintenance practices.
New vs. Recap Tires: Total Cost of Ownership
For long-haul highway routes, recaps offer strong value due to consistent wear patterns, lower upfront cost ($150–$250 vs. $300–$600), and the ability to retread quality casings multiple times, making them ideal for drive axles and lowering cost per mile. For regional or mixed routes, a balanced approach works best: new tires on steers and a mix of new and recaps on drives.
In severe-duty, off-road, or urban stop-and-go environments, new tires are typically the better choice due to higher damage risk reducing recap lifespan; the added durability offsets the higher upfront cost. A simple lifecycle comparison shows new-only strategies carry higher upfront costs with fewer usable life cycles, while recap strategies reduce total cost per mile when conditions support casing reuse.
Brakes and the Compressed Air System
Brakes are a safety-critical system where maintenance isn’t optional, it’s directly tied to stopping distance, inspection compliance, and your ability to stay on the road. The two primary setups, drum and disc, come with different cost structures, service intervals, and performance characteristics, and understanding those differences helps you plan both maintenance and risk.
Drum vs. Disc: Service Reality & Cost
Drum brake reline (per axle): $500–$1,000 all-in
Full tractor-trailer drum service: $1,000–$2,500+
Disc brake pads & rotors (per axle): $800–$1,600
Drum brakes are more common and generally cheaper upfront, but they require more frequent adjustment and are more prone to heat-related fade under heavy use. Disc brakes, while more expensive per service, offer better stopping performance, improved heat dissipation, and more consistent braking, especially in demanding conditions. Over time, discs can reduce downtime and improve safety margins, particularly for fleets running heavy or mountainous routes.
Air System Components & Maintenance Costs
Your braking system depends entirely on compressed air, so neglecting the air system can disable your brakes even if pads and linings are in good shape. Key maintenance items include air dryer cartridges ($50–$150), which remove moisture and prevent corrosion and freezing; slack adjusters ($100–$200), which maintain proper brake stroke and must function correctly to avoid violations; and valves and sensors ($50–$250), which control and monitor system pressure. These components are relatively inexpensive individually but critical to system reliability.
Inspection Cadence & CSA Risk
Brake and air system inspections should happen at every PM interval, with visual checks even more frequently. Out-of-adjustment brakes, air leaks, or contaminated air systems are among the most common reasons for CSA violations and roadside out-of-service orders. Because braking issues are categorized as high-severity safety violations, they can immediately sideline your truck and impact your safety score, insurance rates, and revenue.
Stopping Distance & Safety Impact
Properly maintained brakes don’t just pass inspections, they save lives. Worn linings, poor adjustment, or air pressure issues can significantly increase stopping distance, especially under load. Even a small reduction in braking efficiency can mean the difference between a controlled stop and a collision, particularly at highway speeds.
Cost of Neglect: Real-World Scenario
Skipping routine brake maintenance might save a few hundred dollars in the short term, but the downstream cost can be substantial. For example, a truck placed out-of-service during a roadside inspection for brake violations can lose a full day (or more) of revenue, incur repair costs on the spot, and potentially face towing or emergency service fees at premium rates. What could have been a $600 scheduled reline can quickly escalate into a $2,000+ event when factoring in downtime, expedited repairs, and lost loads.
Brake and air system maintenance is one of the highest-impact areas of your operation. Staying ahead of wear and ensuring proper air system function not only controls costs, it protects your uptime, your CSA score, and everyone on the road.
Engine Health and Aftertreatment Systems
Your engine is the most expensive asset on the truck, and the aftertreatment system is what keeps it compliant. Together, they represent the highest-risk, highest-cost category in semi truck maintenance, where small, proactive investments can prevent five-figure failures.
Routine engine care is relatively affordable and highly effective at extending engine life. A valve and overhead adjustment typically costs $300–$700 and ensures proper timing, fuel efficiency, and combustion balance. Fuel system filter replacements run $50–$150 and are critical for protecting injectors from contamination. These services, when done on schedule, help maintain performance and prevent uneven wear across cylinders.
When maintenance is deferred, costs escalate, Injector replacement can run $2,000–$4,000 for a full set, while a failed turbocharger typically costs $1,500–$3,500. At the extreme end, an inframe overhaul, a full internal engine rebuild, can range from $20,000 to $40,000, often triggered by prolonged wear, oil contamination, or neglected warning signs.
On the emissions side, modern diesel trucks rely on a complex aftertreatment system that includes the DPF, DOC and SCR. Routine DPF cleaning costs $300–$700 and is essential for preventing soot buildup that can restrict exhaust flow. If components fail, replacement costs rise quickly: DPF or DOC units can run $1,500–$4,000+, while an SCR catalyst can reach $3,000–$8,000. Supporting components like DEF heaters and pumps typically cost $200–$800, but failures here can still trigger performance issues and compliance problems.
The biggest operational risk with aftertreatment systems is engine derate, when the truck automatically reduces power due to emissions faults. Common warning signs before a derate include frequent or forced regens, loss of fuel efficiency, warning lights related to DEF or emissions, and reduced engine performance. Acting early, cleaning the DPF, checking sensors, or addressing DEF system issues, can prevent being forced into limp mode on the road.
One of the most effective tools for proactive engine maintenance is oil sampling. Regular oil analysis provides a snapshot of engine health and can catch problems long before they become visible. Key data points to monitor include:
Soot levels: Indicate combustion efficiency and potential DPF or injector issues
Metal content (iron, copper, aluminum): Signals internal wear of engine components
Fuel dilution: Points to injector leaks or incomplete combustion
Coolant contamination: Suggests gasket or liner issues
By tracking these indicators over time, you can make informed maintenance decisions, scheduling repairs when they’re manageable instead of reacting to breakdowns. In the context of semi truck maintenance, this is the difference between a few hundred dollars in diagnostics and tens of thousands in major repairs.
Driveline, Transmission, and Axles
The driveline is what turns engine power into motion, and when something goes wrong here, it rarely stays isolated. Small issues, especially vibration or misalignment, can cascade across components, turning minor repairs into major failures. Understanding the cost structure and early warning signs is key to controlling long-term semi truck maintenance expenses.
Routine service starts with fluid changes and inspections for both manual and automated manual transmissions, typically costing $250–$500. Clean fluid reduces heat and wear inside the gearbox and helps prevent premature failure. Clutch replacements, a common wear item in manual setups, range from $2,000–$4,500 depending on labor and component quality.
Further down the driveline, U-joints and carrier bearings are relatively inexpensive individually, about $200–$500 each, but they play a critical role in maintaining smooth power transfer. When these components wear, they introduce vibration that stresses the entire system. Differential service costs vary widely, with reseals on the lower end and full rebuilds ranging from $1,000 to $5,000, especially if internal gears are damaged.
The Hidden Cost Driver: Vibration & Misalignment
Vibration is the early warning signal most operators overlook. A slightly worn U-joint or improper driveline angle can create harmonic vibration that compounds over time. This doesn’t just affect ride quality, it accelerates wear on transmission output shafts, differential gears and bearings, seals and yokes, even engine mounts in severe cases.
Driveline angle misalignment, often caused by worn suspension components or improper ride height, can rapidly destroy U-joints and lead to repeated failures if not corrected at the root.
Vibration under acceleration only: Likely U-joint wear or driveline angle issue
Vibration at steady highway speed: Possible imbalance, carrier bearing wear, or driveshaft issue
Clunking when shifting or taking off: Worn U-joints or excessive driveline play
Whining or howling from rear: Differential gear wear or low/contaminated fluid
Grinding during shifts: Clutch wear or transmission synchronizer issues
Identifying when and how the symptom occurs helps narrow down the source before it spreads damage further down the line.
Electrical, HVAC, and Driver-Comfort Systems
Electrical and comfort systems may not seem as critical as the engine or brakes, but they’re among the most common causes of unexpected downtime. A no-start condition, charging failure, or HVAC issue can sideline a truck just as quickly as a mechanical breakdown, often with less warning.
High-frequency, moderate-cost electrical failures are especially important to monitor. Batteries typically cost $100–$200 each, and most trucks run 3–4 units, making a full replacement $300–$800. Alternators range from $300–$700, while starters fall between $400–$900. Wiring and harness faults are harder to predict, diagnostic labor alone can run $150–$500, depending on how complex the issue is. These problems can be intermittent and time-consuming to trace, which increases labor costs quickly.
HVAC systems are another critical area, especially for driver comfort and compliance during long hauls. An A/C recharge typically costs $150–$350, while a compressor replacement ranges from $400–$1,200. Smaller components like blend doors and sensors fall in the $100–$400 range but can still impact system performance significantly. For trucks equipped with an APU, routine service runs about $150–$300, while major repairs can range from $500–$2,000, depending on the issue. Keeping the APU in good condition reduces engine idle time and long-term wear.
One of the most overlooked electrical risks is parasitic battery draw, when a component continues to pull power after the truck is shut off. Over time, this can drain batteries and lead to no-start situations. Testing for parasitic draw during inspections can identify faulty circuits or components before they cause downtime.
Modern telematics systems add another layer of protection by monitoring battery voltage trends, charging performance, and fault codes in real time. These systems can flag weakening batteries or alternator issues early, allowing you to schedule maintenance before a roadside failure occurs.
The takeaway: electrical and comfort systems may not always be top of mind, but they’re frequent failure points with real operational impact. Staying ahead of these moderate-cost items helps prevent costly delays, missed loads, and driver dissatisfaction.
Budgeting, Parts Strategy, and Shop Decisions
Turning maintenance costs into a predictable plan starts with one simple rule: budget by the mile, not by the breakdown. A practical range for most operations is 12 to 20 cents per mile for maintenance and repairs, adjusted based on truck age, application, and route severity. Newer trucks on steady highway routes may sit closer to 12–14 CPM, while older equipment or severe-duty operations can push 18–20+ CPM. This approach smooths out cash flow and ensures you’re financially prepared for both routine service and unexpected failures.
Parts Strategy: OEM vs. Aftermarket vs. Reman
Not all parts are created, or priced, the same, and your strategy here directly impacts both uptime and long-term cost. OEM (original equipment manufacturer) parts typically carry the highest price but offer the best fit, reliability, and warranty support, making them ideal for critical systems like engine components or aftertreatment. Aftermarket parts are usually more affordable and widely available, with quality ranging from excellent to inconsistent; they can be a smart choice for non-critical components if sourced from reputable brands. Remanufactured (reman) parts sit in the middle, rebuilt to OEM specs at a lower cost, often with solid warranties, making them a strong value option for items like turbos, injectors, and transmissions. The key is matching part type to risk: save on low-risk items, invest in high-impact components.
In-House vs. Outsourced Labor
Labor is one of the fastest-growing maintenance costs, with shop rates typically running $120–$180 per hour depending on region and facility. In-house maintenance can reduce hourly costs and improve turnaround time, but it requires investment in technicians, tools, and management. Outsourcing to a dealer or independent shop provides expertise and often stronger warranty backing on both parts and labor, but at a premium. The decision often comes down to scale: smaller operators benefit from outsourcing, while larger fleets can justify in-house capabilities for routine work. A hybrid model, handling PMs internally and outsourcing major repairs, is common and effective.
Downtime Calculator: The Hidden Cost
The biggest expense in trucking isn’t always the repair, it’s the time off the road. A simple way to quantify this is:
Lost revenue per day = average daily miles × revenue per mile
For example:
500 miles/day × $2.50/mile = $1,250/day lost revenue
Now factor in a 2–3 day repair delay, and a “$1,500 repair” quickly becomes a $4,000–$5,000 total impact. This is why faster turnaround, parts availability, and shop efficiency often matter more than saving a few hundred dollars upfront.
Vendor Scorecard: Prioritize Reliability Over Price
Choosing the right shop or supplier isn’t just about the lowest quote, it’s about consistency and uptime. A simple vendor scorecard can help you make better decisions over time:
Turnaround Time: How quickly are repairs completed?
First-Time Fix Rate: Does the issue stay fixed, or return?
Parts Quality: OEM, aftermarket tier, or reman reliability
Warranty Support: Coverage length and ease of claims
Communication: Clear updates and accurate estimates
Total Cost Impact: Includes downtime, not just invoice price
Scoring vendors across these categories helps identify who actually saves you money in the long run, not just who looks cheapest on paper.
Successful maintenance budgeting isn’t about cutting costs, it’s about controlling them. By aligning CPM targets, choosing the right parts strategy, and prioritizing uptime in shop decisions, you turn maintenance from a reactive expense into a managed, predictable part of your operation.
Conclusion
Disciplined semi truck maintenance isn’t about reacting to breakdowns, it’s about building a system that makes costs predictable. When you anchor your operation in a consistent PM cadence, stay vigilant across every major system, and budget using a cents-per-mile reserve, you turn unpredictable repairs into planned operating expenses. That shift is what separates stable, profitable operations from those constantly dealing with downtime and cash flow surprises.
The next step is execution. Start with a focused 90-day action plan: align your PM intervals with your actual duty cycle (not just generic schedules), baseline your tire condition and alignment to stop uneven wear early, and schedule DPF service if it’s approaching its limit. At the same time, establish a dedicated maintenance fund based on your CPM target so you’re financially prepared for both routine service and unexpected repairs.
Finally, look backward to move forward. Pull your invoices from the past year and identify your top three maintenance cost categories, whether that’s tires, aftertreatment, or driveline repairs. Don’t just note the totals, dig into the root causes behind those expenses. Were they preventable? Were intervals missed? Were parts or vendors underperforming? Addressing those patterns now puts you in a stronger position before the next peak season hits.
The bottom line: semi truck maintenance is only unpredictable if it’s unmanaged. With the right structure, tracking, and discipline, it becomes one of the most controllable, and optimizable, parts of your business.
FAQs
Q: What is semi truck maintenance and why is it important?
A: Semi truck maintenance refers to all preventive services and repairs needed to keep a truck safe, compliant, and operational. This includes oil changes, brake inspections, tire replacements, and engine diagnostics. Regular maintenance helps prevent costly breakdowns, reduces downtime, and ensures your truck stays profitable on the road.
Q: How much are semi truck maintenance costs per year?
A: Semi truck maintenance costs typically range from $15,000 to $24,000 annually, depending on mileage and operating conditions. On a per-mile basis, most trucks fall between 15–20 cents per mile, though older trucks or heavy-duty operations may cost more.
Q: What is the average maintenance cost for a semi truck per mile?
A: The average maintenance cost for a semi truck is about 15 to 20 cents per mile. This includes preventive maintenance, tires, repairs, and unexpected breakdowns. Tracking cost per mile helps operators budget more accurately and avoid financial surprises.
Q: What does semi truck maintenance and repair include?
A: Semi truck maintenance and repair includes routine services like oil changes and inspections, as well as major repairs such as engine overhauls, transmission work, brake replacements, and aftertreatment system repairs. Preventive maintenance (PM A, B, and C services) plays a key role in reducing the need for expensive repairs.
Q: How often should commercial vehicle service be performed?
A: Commercial vehicle service is typically performed in intervals:
PM A: every 10,000–20,000 miles
PM B: every 20,000–40,000 miles
PM C: every 60,000–100,000 miles
Following these schedules helps catch issues early and extend the life of critical components.
If you file Form 2290 logging vehicles returns, the most important step is classifying the truck correctly. Form 2290 is used to report and pay Heavy Highway Vehicle Use Tax on highway motor vehicles with a taxable gross weight of 55,000 pounds or more.2 Logging vehicles are not fully exempt in most cases, but they do receive favorable treatment under federal law. A qualifying truck generally pays 25% less HVUT than a similar non-logging truck.3
That reduced rate only applies when the truck meets the IRS definition of a logging vehicle and the filer can support that classification with records.1 If the truck later hauls general freight or other non-logging loads, the reduced treatment may no longer apply and an amended filing may be needed.1 For owner-operators, fleet managers, and tax professionals, that makes documentation just as important as the tax calculation itself.
What are Logging Vehicles and do they need to File Form 2290?
A logging vehicle is a highway motor vehicle used exclusively to transport products harvested from the forested site, or to move those harvested products between locations on a forested site, even if public highways are used between those locations.1 The truck also must be registered under the applicable state law as a highway motor vehicle used exclusively in the transportation of harvested forest products.1
The exclusive-use requirement is what separates a true logging vehicle from a truck that only works in the timber business part of the time. Qualifying loads may include logs, timber, pulpwood, bark, chips, sawdust, and similar forest products taken from the harvest site to the first processing point, scale, or storage yard.1 If the same truck hauls general freight, construction materials, unrelated equipment, or any other non-logging load during the tax period, the reduced logging treatment can be lost for that period. In practical terms, a mixed-use truck creates the greatest filing risk.
Form 2290 applies to taxable highway motor vehicles, such as trucks and truck tractors, not to trailers by themselves.1 Many logging operations use pole trailers or other specialized trailers, but the taxable vehicle is still the self-propelled highway unit.
Logging Truck Rules for Form 2290 Filing
The phrase hvut logging truck rules covers the general Form 2290 requirements plus the special reduced-rate treatment for logging vehicles. A taxable truck must meet the 55,000-pound threshold, and the Form 2290 tax year runs from July 1 through June 30.1 The return is usually due by the last day of the month following the month of first use on a public highway.1
The first used month matters because tax is prorated when a vehicle first goes into service after July. If a logging truck is first used on the highway in November, the filer does not owe a full-year amount. Instead, the tax is figured from November through the end of the tax period.1 This is one of the most common error points in Form 2290 filings, especially when trucks are purchased, rebuilt, or newly placed into service mid-year.
An EIN is required to file Form 2290, and businesses that report 25 or more taxed vehicles must file electronically.1 After filing, the stamped Schedule 1 serves as proof of payment and is generally required for state registration or renewal.1 Because of that, the VIN on Form 2290, Schedule 1, and registration records must match exactly.
Filing Rule
Practical Meaning
55,000-pound threshold
HVUT generally starts when taxable gross weight reaches 55,000 pounds or more.2
E-file is required for 25 or more taxed vehicles.1
Registration proof
A stamped Schedule 1 is generally needed for registration.1
Logging Vehicle Exemption 2290
Many searchers use the phrase logging exemption 2290, but that wording often causes confusion. For most taxpayers, logging status is not a full exemption from Form 2290. Instead, it is a 25% reduction in the tax imposed on a qualifying logging vehicle.3 The vehicle is still reported on the return, and the tax still must be paid unless another rule, such as mileage suspension, applies.
A simple rate comparison shows the value of proper classification. At 55,000 pounds, the standard annual HVUT is $100, while the logging rate is $75.1 As the taxable gross weight goes up, the tax increases in graduated amounts, but the logging rate remains 25% lower than the standard amount for the same category.1 At the top annual category, the standard tax reaches $550, while the logging amount is $412.50.1
Taxable Gross Weight
Standard HVUT Example
Logging HVUT Example
55,000 lbs
$100
$75
60,000 lbs
$190
$142.50
75,000 lbs
$550
$412.50
This reduced-rate rule is separate from suspension based on mileage. Form 2290 allows a suspension when a vehicle is expected to be driven 5,000 miles or less during the tax period, or 7,500 miles or less for agricultural vehicles.2 A logging truck may also qualify for suspension if it stays within the mileage limit, but that is a different rule from the reduced logging rate. If the truck later exceeds the mileage threshold, an amended return is required and tax becomes due from the month the limit was exceeded.1
Credits and refunds can also matter. If tax was paid and the vehicle is later sold, destroyed, stolen, or used no more than the applicable mileage limit, the taxpayer may claim a credit on a later Form 2290 or request a refund on Form 8849, Schedule 6.2 That makes mileage and disposition records especially important for logging fleets.
Form 2290 Special Vehicle Rules
The section of the brief titled form 2290 special vehicle rules matters because logging classification is only one part of overall HVUT compliance. Some vehicles are not subject to Form 2290 at all because they are not considered highway motor vehicles. In general, vehicles designed and used primarily for off-highway functions and not customarily operated on public roads may fall outside the tax, depending on their design and actual use.1 Forestry businesses should evaluate that issue carefully when dealing with specialized equipment that operates mostly on private land.
Another important special rule is change in use. If a truck was reported at the reduced logging rate and later begins hauling non-logging loads, the month the change happened should be documented and the return may need to be amended.1 The same is true when taxable gross weight increases because of equipment changes, permit changes, or a different operating configuration.2
VIN corrections are another frequent issue. They do not usually change the tax by themselves, but they are critical because a wrong VIN can delay state registration even when the payment was correct.1 Newly acquired used vehicles can also create special filing questions, especially if the prior owner had already paid or suspended the tax for the period.
How Logging Classification Changes HVUT Treatment
Correct logging classification lowers tax, while weak classification can create back tax, interest, penalties, and registration delays if the IRS or a state agency questions the filing.14 A useful check is to confirm four points in order: the truck is taxable at 55,000 pounds or more,2 the weight category is correct,1 the first used month is correct,1 and the truck meets the IRS logging definition for the period being reported.1 If the final answer changes during the year because the truck begins hauling non-logging freight, the filing position may need to change as well.
Step-by-Step: Filing Form 2290 for Logging Vehicles
Start by confirming eligibility. Review the truck’s actual use, load types, and state registration records to make sure the exclusive-use standard is met.1 Then determine the taxable gross weight and identify the first used month for the current tax period.1
Next, complete the vehicle information carefully. Enter the VIN exactly as shown on the registration, select the proper weight category, and apply logging treatment only if the records support it. Choose an approved payment method, file by the correct deadline, and e-file if the fleet includes 25 or more taxed vehicles.1
After the return is accepted, save the stamped Schedule 1 with the registration documents and keep the supporting records together. During the rest of the tax year, monitor mileage, weight, and actual use. If the truck exceeds a suspension threshold, moves into a higher weight category, or begins hauling non-logging freight, correct the filing promptly rather than waiting until renewal time.1
Proof and Recordkeeping for Logging Status
Strong records are what make a logging classification defensible. The best file usually includes bills of lading, contracts, scale tickets, mill receipts, trip logs, dispatch records, ELD extracts, and state registration documents showing logging use where available.1 Together, those records should show what was hauled, where it came from, and where it went.
Record Type
Why It Helps
Bills of lading and contracts
Show that the loads were harvested forest products.
Scale tickets and mill receipts
Support the product type and destination.
Trip logs and ELD records
Help prove exclusive use and identify non-logging trips.
Registration and permits
Support the state-registration element of the rule.
Mileage summaries
Support suspension claims and change-in-use analysis.
Keep these records for at least three years from the filing date, and longer if there is an amendment, refund claim, or dispute.
Common Filing Mistakes and How to Avoid Them
The most common mistake is calling a mixed-use truck a logging vehicle because it works in timber operations most of the time. The IRS standard is not “mostly.” It is exclusively used for harvested forest products.1 Another common error is failing to amend the return after a change in use, a mileage issue, or a taxable gross weight increase.1
Filers also run into trouble by using the wrong first used month, forgetting proration, or entering a VIN that does not match the registration file.1 Suspension claims can create problems too when mileage records are weak or incomplete. The safest approach is simple: classify conservatively, document thoroughly, and correct changes as soon as they happen.
FAQ: Common Questions About Form 2290 Logging Vehicles
What is considered a logging vehicle for Form 2290?
A logging vehicle is a highway motor vehicle used exclusively to transport products harvested from the forested site and registered under state law as a vehicle used exclusively for that purpose.1
Do logging vehicles pay less HVUT than regular trucks?
Yes. Qualified logging vehicles receive a 25% reduction in the tax that would otherwise apply.3
Is the logging rate a full exemption from Form 2290 tax?
Usually no. It is generally a reduced rate, not a full exemption. A separate mileage suspension may apply if the vehicle stays under the annual mileage limit.2
What happens if my logging truck hauls general freight mid-year?
If the truck no longer meets the exclusive-use requirement, document the month the change happened and determine whether an amended Form 2290 is required.1
What documents prove a truck is a logging vehicle for HVUT?
Useful records include bills of lading, trip logs, ELD data, scale tickets, mill receipts, contracts, and state registration records that support logging use.1
Conclusion
The main issue in Form 2290 logging vehicles compliance is classification. If the truck is truly used exclusively for harvested forest products and the records support that use, the reduced logging rate can lower HVUT in a meaningful way.14 If the truck performs non-logging hauls, however, the treatment can change quickly.
The best practice is to confirm eligibility before filing, use the correct first used month and weight category, keep the VIN and Schedule 1 accurate, and maintain audit-ready proof of logging use. Because tax rules and filing instructions can change, always verify the latest rates and requirements on IRS.gov before you submit the return.1
Pay in trucking is not one fixed number. It changes based on miles, hours, freight, and lanes. If you are comparing job offers or planning a career move, there is more than one right answer to the question: how much do truck drivers make?
A local driver may earn overtime on an hourly schedule, while an over-the-road driver is often paid by the mile and depends on consistent dispatch within Hours of Service rules.
This guide breaks down real-world trucking pay models into clear, practical earnings estimates, including:
Hourly pay
Cents per mile
Salary
Percentage-based pay
It translates those models into day, week, month, and year figures using the latest data from the Bureau of Labor Statistics and FMCSA assumptions.
What Affects Truck Driver Pay
Several factors can change how much a truck driver earns, including:
Route type: local, regional, or OTR
Freight type: dry van, reefer, flatbed, tanker, or hazmat
Geographic region
Endorsements
Bonuses
Accessorial pay
The guide also explains the difference between company driver pay and owner-operator revenue and expenses, so you can compare offers with realistic expectations.
Defining Truck Driver Pay
Before we can answer the income question with actual numbers, we need a clear definition of what “truck driver pay” means. In trucking, pay is not a single number on a rate sheet. Instead, it’s a combination of:
How you’re paid (hourly, per mile, salary, percentage, or day rate)
What time or activity counts as paid work
Which additional pay items apply on a given load or route
Understanding those pieces is essential before comparing job offers or estimating annual income.
The Two Layers of Truck Driver Pay
Truck driver compensation usually works in two layers: the base pay model and the earnings adjustments that affect your final take-home pay.
1. Base Pay Models
The first layer is the structure used to calculate your primary pay.
Hourly pay – Drivers are paid for each hour on duty, often with overtime after 40 hours in a week. This model is common for local routes and dedicated accounts.
Cents per mile – Drivers earn a set rate for every paid mile, usually based on dispatched miles rather than odometer miles.
Salary – A fixed weekly or pay-period amount, sometimes combined with performance incentives.
Percentage of load – Drivers receive a set percentage of the linehaul revenue for each load. This model is more common for owner-operators or specialized fleets.
Day rate – A flat payment for a shift or route. Some carriers combine day rates with mileage or stop pay.
2. Factors That Change Real Earnings
The second layer includes the pay elements that can significantly increase or decrease your effective hourly or weekly income.
Common additions include:
Detention pay – Compensation for waiting at a shipper or receiver.
Layover pay – Pay for unexpected overnight delays between loads.
Stop pay – Extra pay for additional pickups or deliveries.
Specialized task pay – Tasks like tarping or load securement for flatbed freight.
Per diem programs – Part of income is treated as a non-taxable allowance, changing taxable income but not necessarily total pay.
Performance bonuses – Safety, fuel efficiency, or on-time delivery incentives.
These factors can make a major difference in what a driver actually earns.
For example:
A driver earning $0.60 CPM who runs 2,400 paid miles would make $1,440 before accessorial pay.
A driver earning $27 per hour who works 45 hours would earn $1,215 before taxes.
However, if that same hourly driver works 55 hours with time-and-a-half after 40, their weekly earnings could exceed the CPM example.
The key takeaway is that the unit of pay (mile vs. hour) and the actual miles or hours worked determine real income.
When asking how much truck drivers make, two job offers with similar advertised rates can produce very different weekly results depending on:
Miles available to run
Overtime eligibility
Accessorial pay
Dispatch consistency
Understanding these components helps drivers evaluate offers more accurately and predict realistic weekly income.
With these definitions in place, the next step is to look at the national trucking pay picture for 2026. That baseline will help you benchmark job offers before diving into detailed pay models and real-world earning scenarios.
Truck Driver Pay Structures Explained
Understanding how drivers are paid matters just as much as the headline rate. Different pay structures reward different behaviors, miles driven, hours worked, or load value, which is why answers to how much truck drivers make can vary widely even when the advertised rate looks similar.
Use the models below to understand how each structure translates into real weekly and hourly earnings.
Cents-Per-Mile: Productivity-Driven Pay
CPM pay ties earnings directly to the number of dispatched miles you run.
Example calculation:
$0.60 CPM × 2,600 miles = $1,560 weekly gross
How that translates hourly depends on how much time is spent on duty:
If the week requires 52 on-duty hours, the effective hourly rate is about $30/hour.
If delays increase on-duty time to 65 hours, the effective rate drops to roughly $24/hour.
CPM rewards:
Consistent freight
Efficient dispatch
Minimal waiting time
However, unpaid dwell time at shippers or receivers can reduce the real hourly value of a mile-based rate.
Hourly Pay
Many local, city, and pickup-and-delivery positions use hourly pay.
These jobs often include overtime rules such as:
Time-and-a-half after 40 hours per week
Sometimes overtime after 8 hours per day in union environments
Example:
$28/hour for 50 hours worked
40 hours × $28 = $1,120
10 hours × $42 (time-and-a-half) = $420
Total weekly pay: $1,540
This pay model protects earnings on:
Heavy traffic days
Short routes with frequent stops
Long loading or unloading delays
Because all on-duty time counts, detention is effectively paid automatically.
Salary or Day-Rate: Stable Paychecks, Variable Hourly
Some carriers offer fixed weekly salaries or daily rates to provide predictable income.
Example:
$300 day rate × 5 days = $1,500 per week
But the effective hourly depends on how long each shift lasts:
8-hour days → $37.50/hour
12-hour days → $25/hour
Before accepting a salary or day-rate position, clarify:
Minimum work guarantees
Expected daily hours
Load or route requirements
Pay policies during breakdowns or slow freight periods
Percentage of Load: Earnings Tied to Freight Revenue
Under this model, drivers earn a percentage of linehaul revenue, often 23%–30%.
Example:
Load 1 linehaul: $1,800
Load 2 linehaul: $2,200
Total linehaul: $4,000
At 25%, the driver earns $1,000 for the week before extras.
This structure can outperform CPM when:
Freight rates are strong
Lanes are high-paying
Accessorial pay is included
However, it can also fluctuate with market rate changes and broker pricing.
Accessorial Pay: Small Items That Add Up
Accessorial pay compensates drivers for work that isn’t simply driving miles.
Common examples include:
Detention: $15–$30 per hour after a grace period
Layover: $100–$200 per day
Stop pay: $15–$50 for extra stops
Tarp pay: $50–$100
Breakdown pay
Short-haul minimums
Weekly income guarantees
Even small amounts can add up quickly.
Example:
4 hours of detention at $25/hour = $100 extra pay
Weekly guarantees can also stabilize income, for example, a $1,100 weekly minimum during slow freight or equipment downtime.
Per Diem and Performance Incentives
Many carriers offer per diem programs that shift part of driver income into non-taxable reimbursements for meals and incidentals while away from home.
Typical ranges:
$60–$70 per day, based on federal per diem guidelines
This can increase take-home pay after taxes, even if the taxable wage appears lower.
Additional incentives may include:
Safety bonuses
Fuel efficiency bonuses
On-time delivery bonuses
These bonuses often add:
$0.01–$0.05 CPM, or
$50–$200 per month
Over time, these incentives can significantly narrow the earnings gap between different pay models.
The structure of pay determines how time, miles, and delays translate into real income. Two drivers with similar advertised rates may earn very different weekly totals depending on:
Pay structure
Freight availability
Waiting time
Accessorial pay
Next, we’ll convert common trucking pay setups into hourly, daily, weekly, monthly, and annual earnings so you can compare job offers side-by-side.
Truck Driver Pay, National Averages and What They Mean
National averages provide a quick benchmark for truck driver pay, but the mean alone hides wide differences based on experience, route type, freight specialization, and pay structure. To understand what drivers actually earn, you need both the middle of the market and the spread around it, along with a clear understanding of what time counts as paid work.
National Average Pay for Truck Drivers
According to the latest Bureau of Labor Statistics Occupational Employment and Wage Statistics for Heavy and Tractor-Trailer Truck Drivers (Occupation 53-3032), the national averages are:
Average hourly wage: $26.92
Average annual salary: $55,990
But that single average masks a broad range across the industry.
The 10th to 90th percentile pay range stretches significantly:
Lower end: roughly mid-$30,000s annually
Middle of the market: around low-$50,000s
Upper end: upper-$70,000s to low-$90,000s
On an hourly basis, that distribution translates roughly to:
High-teens per hour at the low end
Mid-$20s per hour around the median
High-$30s per hour at the top
These differences reflect not only experience and tenure but also job type, freight specialization, and regional market conditions.
How Drivers Move Through the Pay Range
Understanding how drivers progress through this pay range is more useful than focusing on the average alone.
Entry-level company drivers typically start in the lower quartiles while they build a safe driving history, learn new lanes and freight patterns, and complete probationary periods.
After a year or two of clean driving records and consistent performance, many drivers move toward the middle of the pay distribution as they gain access to higher mileage routes, dedicated accounts, and pay step increases.
Drivers in the top quartile of earnings often work in roles that require greater responsibility, experience, or time away from home. Examples include LTL linehaul positions with seniority, team OTR operations running high weekly miles, and specialized freight such as flatbed, tanker, or hazmat that requires endorsements and additional handling.
Gross Pay vs. Effective Pay
National averages also blur a critical distinction: gross pay versus the effective value of your working time.
For example, under a mileage-based pay model:
2,400 miles × $0.60 CPM = $1,440 weekly linehaul pay
Add 6 hours of detention at $25/hour = $150
Total weekly gross: $1,590 before taxes and benefits
However, if traffic congestion or loading delays reduce drivable miles, the weekly income falls even though the CPM rate stays the same.
Compare that with an hourly local role:
$28 per hour × 50 hours = $1,400 weekly base pay
Overtime rules and shift premiums determine whether that number increases as the workweek expands. Two drivers may report similar yearly earnings, but the predictability and structure of their weekly pay can be very different.
The Role of Accessorial Pay
Accessorial payments are often the hidden factor behind higher weekly totals. These payments compensate drivers for work that mileage pay alone doesn’t capture.
Common accessorial pay includes:
Detention pay
Layover pay
Stop pay
Breakdown pay
Tarping pay for flatbed loads
Carriers also frequently add:
Safety bonuses
Fuel-efficiency incentives
Performance bonuses
Per diem programs that adjust taxable income
During periods of strong freight demand, these extras can significantly increase weekly earnings. During slower freight cycles, they can help stabilize income.
Geography and Cost of Living
Another factor hidden inside national averages is regional variation.
A single national pay figure blends together high-paying metropolitan freight hubs, lower-paying rural regions and dense port and intermodal markets where hourly pay rises but miles may decrease due to congestion.
The same salary can have very different purchasing power depending on where a driver lives or where their routes originate.
The Operational Ceiling: Hours of Service
Finally, every trucking job operates under the limits set by federal Hours of Service regulations.
Drivers are generally limited to:
11 hours of driving within a 14-hour duty window
60 or 70 on-duty hours over 7 or 8 days
Because of these limits, earnings depend heavily on utilization, how efficiently those legal hours are used. Factors that influence utilization include dispatch efficiency, appointment scheduling, loading and unloading delays, and shipper and receiver operations.
Two drivers working under the same pay rate can end up in very different earnings brackets depending on how productive their available hours are.
How Much Do Truck Drivers Make a Week
Weekly pay is where the numbers start to matter most for drivers comparing job offers or planning household budgets. The question how much do truck drivers make becomes much clearer when pay models are translated into a realistic week of miles or hours, then adjusted for accessorial pay.
Real-World Weekly Example
Consider a regional dry van driver named Jordan who is paid $0.60 per mile.
In a typical week, Jordan runs 2,200 paid miles, plus a few additional payments:
3 hours of detention at $25 per hour
2 extra stops at $20 per stop
Weekly pay calculation:
Mileage: 0.60 × 2,200 miles = $1,320
Detention pay: $75
Stop pay: $40
Total weekly gross: $1,435
Weekly earnings can vary depending on miles run:
Slower week (1,700 miles): about $1,195
Typical week (2,200 miles): about $1,435
Strong week (2,600 miles): about $1,675
Even with the same CPM rate, weekly income changes significantly depending on freight volume and dispatch efficiency.
Pay Model Drives the Spread: CPM vs. Hourly
Mileage-based pay turns distance into income, while hourly pay turns time into income.
Using Jordan’s $1,435 CPM week as a reference, compare it to a local hourly driver:
$28 per hour
50 hours worked
10 hours overtime (time-and-a-half after 40 hours)
Weekly calculation:
40 hours × $28 = $1,120
10 hours × $42 = $420
Total weekly pay: $1,540
In markets with heavy congestion or frequent loading delays, hourly structures can produce more consistent weekly earnings.
Utilization Volatility Is the Biggest Lever
The largest factor affecting CPM earnings is utilization, the number of miles a driver can run in a given week.
At $0.60 CPM, every 500-mile change shifts weekly income by $300.
Jordan’s example illustrates this clearly:
1,700 miles: slower freight week
2,200 miles: average productivity
2,600 miles: strong utilization week
Weather disruptions, freight demand, and shipper delays can all affect mileage totals even when the pay rate stays the same.
Accessorial Pay Cushions Slow Weeks
Accessorial payments help offset lost productivity when miles drop.
Typical accessorial pay includes:
Detention
Layover
Stop pay
Breakdown pay
In Jordan’s example, $115 in accessorial pay (detention plus stop pay) accounted for roughly 8% of weekly gross income. That amount may feel small during a high-mileage week but becomes much more important when miles decrease.
Team Driving: More Miles, Split Pay
Team operations often run much higher weekly miles, but the pay is split between drivers.
Example:
Truck rate: $0.80 CPM
Weekly miles: 6,000
Each driver effectively receives half of the truck rate:
$0.40 CPM per driver
Mileage pay per driver:
0.40 × 2,400 miles ≈ $960
When teams run stronger weeks of 7,000–7,500 miles, individual pay increases even though the rate itself stays the same. Like solo CPM pay, utilization remains the key driver of earnings.
Weeks Worked Matter as Much as Weekly Pay
Estimating annual income using 52 identical weeks can be misleading. Most drivers take time off for vacation, home time, equipment maintenance and slow freight periods.
Many drivers realistically work 48 to 50 paid weeks per year.
Using Jordan’s typical week of $1,435:
48 weeks: about $68,880
52 weeks: about $74,620
This perspective helps drivers compare job offers more accurately and set realistic annual income expectations.
Geography, Lanes, and Cost of Living
Where you drive and which lanes you run can dramatically change what a “good” pay rate actually means. State or national averages often hide two critical variables that shape real driver income:
How many productive miles or paid hours you can log in a typical week
The cost of living where you live and park the truck
Geography, lane balance, congestion, and local freight mix all interact to determine how much a posted rate translates into actual take-home pay.
High-Pay Coastal and Port Markets
Dense coastal regions and port-heavy markets often advertise higher hourly wages or higher CPM rates. These markets frequently pay premiums because of heavy congestion, long wait times at ports or distribution centers, and tighter labor markets.
However, these same conditions can reduce productivity. Traffic delays, short-haul turns, and shipper dwell times often limit how many miles drivers can run in a week.
For example:
A driver running urban Northeast lanes at $0.70 CPM but averaging 2,000 miles per week because of congestion might gross about $1,400 before accessories.
A local pickup-and-delivery driver earning $30 per hour for 45 hours would gross about $1,350 for the week, often with more predictable scheduling.
In these markets, policies such as detention pay, stop pay, and minimum pay guarantees become especially important because they compensate drivers for lost driving time.
Long-Haul Corridors and Higher Utilization
Long-haul freight corridors in the Midwest, Plains, and Southwest typically offer slightly lower CPM rates but allow for more consistent movement and higher weekly mileage.
These regions tend to have fewer traffic bottlenecks, longer average lengths of hauls and faster loading and unloading cycles.
Higher utilization can offset lower rates.
Example:
$0.65 CPM × 2,700 miles = $1,755 weekly gross
Even though the rate per mile is lower than the Northeast example, the higher mileage produces a stronger weekly total. Drivers who prioritize maximum weekly earnings over daily home time often find these freight-dense regions more consistent across the year.
Lane Balance and Freight Direction
Another geographic factor is lane balance, the relationship between inbound and outbound freight.
Some regions have strong freight flowing in but weaker freight leaving the market. This imbalance can lead to:
Deadhead miles
Longer wait times for reloads
Lower overall productivity
Common examples include:
Florida produce markets
Upper New England retail inbound lanes
Energy-sector freight swings in oil regions
Drivers who run balanced lane networks, where outbound freight is as reliable as inbound, often earn more consistent weekly income.
Even slightly lower-paying freight on a balanced lane triangle can outperform a high-paying inbound lane that forces drivers to deadhead or sit idle waiting for the next load.
Cost of Living and Real Purchasing Power
Cost of living also changes how meaningful a salary really is once the paycheck reaches the household budget.
Higher average trucking wages are often reported in places such as:
Alaska
New Jersey
Washington
The District of Columbia
Meanwhile, lower averages appear in many parts of the Southeast.
However, higher wages in major metro areas are often offset by:
Housing costs
Taxes
Everyday living expenses
For example:
A $75,000 annual trucking income in a high-cost metro area may provide similar purchasing power to $65,000 in a lower-cost region with steady freight.
For local and regional drivers who must live near their terminal, this difference shows up immediately. Over-the-road drivers sometimes benefit from geographic arbitrage, living in a lower-cost state while running freight through higher-paying markets.
The Bottom Line on Geography and Pay
The “best” location for trucking pay depends on what matters most to the driver:
Higher pay per mile or per hour
Maximum weekly miles
Consistent reloads and balanced lanes
Strong purchasing power at home
That’s why answering how much truck drivers make requires more than looking at the posted rate. Real earnings depend heavily on lane quality, freight flow, congestion, and local cost of living as much as the pay structure itself.
How Pay Is Structured in Trucking
Most pay disputes in trucking start with a misunderstanding of the pay model, not the headline rate. Small details in how miles, time, and extras are paid can change weekly income by hundreds of dollars. Before accepting an offer or quoting a job, use the checks below to spot common traps.
Chasing the Highest CPM Without Confirming Average Miles
A $0.70 CPM advertisement can actually earn less than a $0.58–$0.62 CPM position if the higher rate comes with fewer miles or frequent short-haul loads. Carriers can easily market a higher rate, but utilization, how many miles you actually run, is harder to verify.
Ask the recruiter or fleet manager for the last 90 days of average paid miles for the exact fleet or lane, and request it in writing.
Example comparison:
0.58 × 2,600 miles = $1,508 weekly
0.70 × 1,900 miles = $1,330 weekly
In this case, the lower CPM with steady miles produces higher weekly pay.
Not Checking How Miles Are Measured
Mileage pay depends heavily on how the carrier calculates miles.
Common methods include:
HHG miles (shortest route)
Practical miles
Hub or odometer miles
Some carriers also exclude deadhead miles or pay them at a reduced rate. The difference between mileage methods can reduce expected earnings by 3–8%.
Always verify in writing:
Whether miles are HHG, practical, or hub
Whether deadhead miles are paid
If deadhead is paid at full CPM, reduced CPM, or flat pay
Example:
2,400 HHG miles × $0.60 = $1,440
If the real hub distance averages 2,520 miles, using HHG leaves about $72 per week unpaid.
Assuming All On-Duty Time Is Paid Under CPM
Under mileage pay, many on-duty tasks are not automatically compensated.
These often include:
Pre-trip inspections
Post-trip inspections
Fueling
Waiting at docks
Detention pay usually begins only after a grace period of 2–4 hours, and some carriers require dispatcher approval before it starts.
Always confirm:
The detention trigger time
The hourly detention rate
Whether approval is required
Example:
Five hours waiting at a shipper
First 2 hours unpaid grace period
$25/hour detention rate
If detention begins after two hours, you receive 3 hours × $25 = $75.
If detention begins after four hours, only 1 hour is paid = $25.
Misreading Overtime Eligibility
Many interstate drivers fall under the Motor Carrier Exemption, which means overtime laws may not apply. Local and regional roles are more likely to include overtime pay, but the threshold varies.
Overtime policies may include:
Time-and-a-half after 40 hours
Time-and-a-half after 50 hours
No overtime pay
Example comparison:
$28/hour × 50 hours with overtime after 40
40 × $28 = $1,120
10 × $42 = $420
Total: $1,540
$28/hour × 50 hours with no overtime
50 × $28 = $1,400
A misunderstanding of overtime policy can easily distort expected annual income.
Overlooking Accessorial Pay and Per Diem Details
Many trucking ads highlight CPM while excluding additional pay categories such as:
Stop pay
Tarp pay
Unload pay
Layover pay
Breakdown pay
Holiday pay
Per diem programs can also affect how earnings appear. They may increase take-home pay but reduce taxable wages, which can influence some benefits calculations.
Request the full pay rate sheet before accepting an offer.
Example estimate:
4 extra stops per week × $20 stop pay
Weekly extra pay: $80
Monthly extra pay: about $346 (based on 4.33 weeks)
Also confirm:
The per diem amount
How it is applied to mileage or hourly pay
How it affects taxable income and base wages
Percentage-of-Load Without Knowing the Base
Some trucking jobs pay a percentage of load revenue, but the definition of that revenue varies.
Some contracts calculate percentage on linehaul only, excluding:
Fuel surcharge
Accessorial charges
Additional fees
This reduces the driver’s share of the load.
Always ask: “Percentage of what?” and review sample settlements.
Example:
25% of $3,000 linehaul = $750
If the load also includes:
$600 fuel surcharge
$100 accessorial pay
Total load value: $3,700
If the percentage only applies to linehaul, the driver loses $175 compared with receiving 25% of the full amount.
The Key Takeaway
When comparing offers and estimating how much truck drivers make, convert every job to the same unit, weekly dollars based on verified miles or hours and the full pay policy.
Taking the time to check these details turns an attractive headline rate into a clear, apples-to-apples comparison of real earnings potential.
Market Cycles, Seasonality, and What Changes Year to Year
Truck driver pay does not move in a straight line, it follows the freight market. Capacity, shipper demand, and diesel prices rise and fall on their own timelines, and those changes ripple through rates, miles, and the types of loads available. Understanding this rhythm helps turn static pay figures into a more realistic, dynamic view of what drivers can expect to earn over time.
Freight Cycles and Their Impact on Earnings
Freight markets typically move in recognizable cycles. When demand rises faster than the supply of trucks and drivers, such as during the freight surge of 2020–2021, spot rates climb, detention is easier to bill, and available miles increase. In contrast, when new capacity enters the market and freight demand cools, as seen during 2023–2024, spot rates soften, contract rates tighten, and competition for productive miles increases.
These shifts affect different types of drivers in different ways.
Owner-operators often feel diesel price swings most directly. When fuel prices spike quickly, operating costs rise immediately. Until fuel surcharges or rates adjust, higher diesel prices can temporarily reduce net income.
Company drivers experience the cycle differently. Their base pay rate may remain stable, but during softer freight markets they may see fewer weekly miles, reduced bonus opportunities, land less overtime or incentive pay.
Because of these factors, the answer to how much truck drivers make changes with the market cycle rather than remaining fixed year to year.
Seasonal Patterns in Trucking
Seasonality adds another layer on top of broader freight cycles. Certain freight segments consistently follow seasonal patterns.
Examples include:
Refrigerated freight: spring produce season and late-year retail demand
Flatbed freight: construction and manufacturing cycles
Tanker freight: agricultural and chemical production schedules
Winter conditions also play a role. Snow, ice, and shorter daylight hours often slow average driving speeds and increase detention risk. While this can increase hourly pay or accessorial earnings, it may reduce total weekly miles for drivers paid primarily by CPM.
Regional freight surges can also shift lane balance temporarily. Harvest seasons, port activity spikes, and major retail cycles can strengthen outbound freight in some regions while weakening it in others. These shifts influence weekly earnings depending on whether drivers are paid hourly, by the mile, or by a percentage of load revenue.
Career Strategy During Market Swings
Freight cycles also influence long-term career strategy. Drivers with additional endorsements or equipment experience can move more easily between freight segments when the market shifts.
For example:
Hazmat or tanker endorsements can open specialized freight opportunities
Flatbed experience can provide access to construction-related freight
Reefer work may offer more consistent seasonal demand
Fleet structure matters as well. Companies that rely heavily on contract freight often trade higher peak earnings for greater stability during slower markets. Operators working heavily in the spot market can outperform during strong cycles but must manage risk carefully when rates decline.
Drivers and fleet owners often watch a few key indicators to anticipate market changes:
Diesel price trends
The number of new carriers entering or leaving the market
Tender acceptance and rejection rates from shippers
Monitoring these signals helps drivers decide when to pursue more miles, adjust lanes, or negotiate better accessorial terms.
Bringing It All Together: What Truck Drivers Really Make
Truck driver income is the result of several factors working together: the pay model, how many miles or hours you can realistically run, the protections built into the pay structure, and the lanes you operate within federal Hours of Service limits.
The most accurate way to understand how much truck drivers make is to convert every offer into expected weekly income using verified miles or hours. From there, add accessorial pay, consider how per diem programs affect take-home pay, and estimate the number of working weeks in a year. Geography, freight demand, and seasonal shifts will influence those totals, but the underlying rule stays the same: productivity you can actually achieve, and policies that compensate your time, matter more than headline CPM or hourly numbers.
Drivers comparing jobs should pressure-test each opportunity by requesting real data. Ask carriers for recent averages on weekly miles or paid hours, review the full rate sheet for accessorial pay, and understand how overtime, detention, and guarantees are handled. With that information, you can choose the mix of route type, freight segment, and schedule that turns your hours on duty into reliable income.
Frequently Asked Questions About Truck Driver Pay
How does truck driver pay work, and what are the common pay models?
Trucking pay typically combines a base pay model with additional compensation. The most common base structures include:
Hourly pay
Cents per mile
Salary
Day-rate pay
Percentage of load revenue
Each structure converts time, miles, or load value into income differently. On top of the base pay, drivers may earn accessorial pay for work that isn’t strictly driving. These can include detention, layover, and stop pay.
Some carriers also offer per diem programs, which shift part of earnings into a non-taxable reimbursement category for meals and incidental expenses. Ultimately, your true weekly and hourly pay depends on utilization, the number of miles or paid hours you actually log under the pay structure.
How do geography, lane patterns, and cost of living change the real value of my pay?
Location and freight lanes can significantly affect how much you actually earn.
Coastal and port markets often advertise higher rates but may limit miles due to traffic, short-haul routes, and congestion. In these areas, accessorial pay and minimum guarantees become more important.
Midwest and Southwest freight corridors may offer slightly lower CPM rates but allow higher weekly miles and more consistent movement, which can lead to stronger weekly totals.
Lane balance matters as well. Routes with strong outbound and inbound freight reduce deadhead miles and waiting time.
You should also compare income against local housing costs, taxes, and everyday expenses to determine the true purchasing power of a paycheck.
Which is better for drivers: cents-per-mile or hourly pay?
The best option depends on the type of freight and driving environment.
CPM pay works best when freight flows steadily, dwell times are low, and drivers can run high weekly miles within Hours of Service limits. However, unpaid waiting time can reduce the effective hourly rate.
Hourly pay protects drivers from income loss during traffic, yard work, and loading delays. It may also increase weekly income when overtime rules apply.
Drivers working in urban markets with frequent stops often prefer hourly pay, while those running long-haul routes with predictable miles may earn more with CPM.
How do accessorials, per diem, and bonuses affect my income?
Accessorial pay compensates drivers for work beyond driving miles. Common examples include:
Detention: roughly $15–$30 per hour after a grace period
Layover: about $100–$200 per day
Stop pay for additional pickups or deliveries
Tarp or securement pay in flatbed operations
These extras can add hundreds of dollars per month and help offset weeks with lower mileage.
Per diem programs move part of income into a non-taxable meal allowance, increasing net pay after taxes but reducing taxable wages used for certain benefits calculations.
Carriers may also offer safety bonuses, fuel-efficiency bonuses, or performance incentives, often adding small CPM increases or monthly cash bonuses.
What are common misconceptions about truck driver pay, and how do I avoid them?
A common mistake is chasing the highest CPM rate without verifying average weekly miles. A lower rate with steady miles can outperform a higher rate with inconsistent freight.
Other pitfalls include:
Assuming all on-duty time is paid in mileage jobs
Not checking whether miles are calculated using HHG, practical, or hub methods
Failing to confirm deadhead pay policies
Misunderstanding overtime eligibility
Accepting percentage pay without knowing what portion of the load revenue it covers
Drivers should request the last 90 days of average miles or hours and review the full pay policy in writing before accepting an offer.
How do local, regional, and OTR routes differ in pay and home time?
Different route types balance pay and lifestyle differently.
Local routes typically pay hourly, may include overtime, and offer daily home time. Weekly income is often more predictable but may involve fewer miles.
Regional routes usually combine CPM pay with accessories and offer weekly home time with moderate mileage swings.
OTR jobs maximize weekly miles and earning potential but require longer stretches away from home.
Team driving can further increase weekly mileage by keeping the truck moving around the clock, although the truck’s total pay is split between drivers.
The most experienced truck drivers do not evaluate a carrier the way a recruiter or marketer does. They do not begin with slogans, culture statements, or broad promises about respect. Instead, they begin with the week in front of them. They ask whether the next load is planned clearly, whether home time will happen when promised, whether a breakdown will be handled quickly, whether payroll will be accurate, and whether someone on the other end of the phone will solve problems without wasting time. Over time, these practical questions become the true measure of whether a company deserves loyalty.
That is why articles about driver retention often feel disjointed when they treat pay, culture, safety, equipment, technology, and communication as separate topics. For veteran drivers, these factors are not separate. They are parts of the same operating system. A driver who receives a vague dispatch message is more likely to lose time at the shipper. A driver who loses time at the shipper may also lose parking options, rest, and income. A driver who cannot get fast approval for detention or lumper fees may still finish the week exhausted but underpaid. The issue is not only compensation or only communication. It is whether the system protects a professional driver’s time, safety, and ability to perform well.
For that reason, the strongest way to understand what experienced truck drivers value is to treat the driver experience as a chain of connected operational decisions. Communication creates trust. Predictable freight creates control. Transparent pay protects confidence. Reliable equipment protects uptime. Safety-first policies protect judgment. Responsive support keeps disruptions from turning into lost days. When these pieces work together, a carrier becomes easier to stay with. When they break apart, even a decent pay package can feel unstable.
Why Do Experienced Truck Drivers Judge Carriers by Daily Operations Instead of Recruiting Promises?
Experienced drivers have already lived through enough mismatches between recruiting messages and daily reality to know where the truth shows up. It shows up in the dispatch message sent before a load begins. It shows up in whether appointment times were realistic. It shows up in how detention is documented, how long a repair takes, and whether anybody calls the customer before a small delay becomes a major service problem. Veteran drivers tend to trust operational consistency far more than brand language because consistency affects their work every single day.
This perspective also explains why driver loyalty is often misunderstood. Loyalty is not usually built through emotional messaging alone. It is built when a carrier removes preventable friction from the job. If a driver can count on accurate information, dependable support, fair pay treatment, and honest scheduling, the job becomes more manageable and more professional. If those basics are missing, every week feels heavier than it should. The carrier may believe it has a morale problem, when in fact it has a design problem.
Government and industry research reinforces this practical view of the job. FMCSA notes that fatigue can result from inadequate sleep, extended work hours, and strenuous demands, and reports that 13 percent of CMV drivers were considered fatigued at the time of their crash in the Large Truck Crash Causation Study 1. NIOSH likewise emphasizes that high job demands and low control, including tight delivery schedules and delays, can cause stress and poor health outcomes for long-haul drivers 2. In other words, the way a fleet plans work is not just a convenience issue. It shapes safety, health, and retention.
Whether the company respects time and prevents avoidable surprises
Lanes and home time
Whether life outside the truck can be planned with confidence
Pay settlements
Whether the company is honest when details get complicated
Equipment and maintenance
Whether the company protects uptime and income
Safety decisions
Whether the company respects professional judgment under pressure
Back-office support
Whether problems are solved quickly or passed around
What Kind of Communication Do Truck Drivers Actually Want From a Carrier?
Experienced truck drivers do not want more communication for its own sake. They want better communication. That distinction matters. Repeated check calls, fragmented text chains, and late-arriving load details can create the illusion of activity while increasing confusion and interrupting rest. What drivers actually value is communication that is complete, timely, and structured around decisions. They want to know what matters before the load begins, what changes during the trip, and who can solve a problem when conditions shift.
A strong communication model begins with a full load brief rather than scattered pieces of information. The driver should not have to assemble the trip from five separate messages and two later clarifications. At a minimum, the load brief should clarify pickup and delivery windows, customer quirks, routing constraints, paperwork, securement requirements, detention rules, and the process for reporting exceptions. When this information arrives early and in one place, the driver can plan hours, fuel, parking, and risk. When it arrives late, every later problem feels preventable.
Just as important, communication has to be disciplined when plans break. A dispatcher who sends one clear update with a revised timeline, next step, and contact path is doing more than relaying information. That dispatcher is preserving trust under pressure. The opposite approach—mixed messages, side-thread texts, unclear approvals, or silence until the driver calls again—forces the driver to manage the company’s internal disorder while still managing the load.
Communication quality also depends on cadence. Exception-based updates are usually better than constant interruptions because they respect driver autonomy and time. FMCSA’s fatigue guidance emphasizes the importance of adequate rest and the risks of impaired alertness, particularly during natural circadian low points after midnight 1. If a carrier claims to value safety but repeatedly disrupts rest with noncritical calls and messages, drivers notice the contradiction immediately.
How should carriers structure communication so drivers trust it?
The most effective pattern is simple. Start with a complete load brief. Move to exception-based updates when something material changes. Publish response standards for dispatch, safety, maintenance, and payroll. Keep all approvals and changes in one system so night coverage can see what day coverage already handled. Then close the loop after each disruption so the same avoidable mistake does not appear on the next load.
This is where communication becomes a retention tool rather than an administrative task. Drivers stay where they do not have to fight for clarity. They stay where the information is organized enough to let them do the job professionally.
How Do Predictable Freight, Stable Lanes, and Honest Home Time Improve Driver Retention?
Predictability is often undervalued because it looks less dramatic than a pay increase or a sign-on bonus. Yet for experienced drivers, predictable weeks frequently matter more than occasional high-earning weeks that come with constant volatility. Stable lanes, realistic appointment windows, advance preplans, and truthful home-time commitments reduce uncertainty across the entire job. They also make it easier for drivers to protect sleep, personal obligations, and income.
This matters because long-haul work already includes structural stress. NIOSH explains that life on the road is made harder by irregular schedules, long hours, stress, limited physical activity, and limited access to healthy food 2. When a carrier adds unnecessary schedule volatility on top of those conditions, it turns a demanding job into an exhausting one. Predictable freight cannot remove every challenge from trucking, but it can reduce the number of avoidable ones.
Honest home time is especially important. Many drivers can tolerate a hard week if they trust the plan. What destroys trust is a pattern of promising one thing and delivering another. If home time is missed, the company should communicate early, explain why, and make the remedy visible. Veteran drivers do not expect perfection from a live freight network. They do expect honesty, foresight, and follow-through.
Predictability also affects safety and parking. FMCSA’s current truck parking research recognizes that parking shortages create measurable costs, including extra miles driven to find parking, unauthorized parking, early stopping, and off-route driving 3. When appointments are unrealistic or the next load is not planned until the last moment, those parking and rest pressures intensify. Good operations design therefore protects both schedule integrity and driver well-being.
Which operational habits make schedules feel reliable?
The habits are usually small but consistent. Preplan before delivery rather than afterward. Build appointment windows that reflect actual customer behavior. Track planned versus actual home time. Watch which customers regularly create dwell, missed windows, or late-night parking problems, then use that data to challenge assumptions in customer planning. Stability does not come from one policy statement. It comes from repeated operational discipline.
Schedule issue drivers experience
Operational response that builds trust
Last-minute lane swaps
Issue preplans 24 to 48 hours ahead whenever possible
Missed home time
Track compliance and communicate make-good steps clearly
Unrealistic appointments
Adjust planning standards using actual dwell and travel data
Parking pressure late in the day
Plan route timing and stop windows with parking realities in mind
Surprises at shipper or receiver
Add site-specific notes to every repeat load brief
What Does Pay Transparency Look Like to Veteran Truck Drivers?
For experienced drivers, compensation is about more than headline rate. Pay transparency means being able to understand how money is earned, when accessorials apply, how exceptions are documented, and how errors are corrected. Drivers do not want to decode settlements like accountants. They want clean, line-item clarity that matches what actually happened during the week.
This is one of the easiest areas for carriers to underestimate. Leaders may assume that drivers only care about the top rate or the gross weekly average. In reality, veteran drivers often judge trustworthiness by the small details. Was detention captured from the right time? Did the layover payment match policy? Was a lumper fee reimbursed without repeated follow-up? Did payroll explain the adjustment, or did the driver have to chase it? Ambiguity in these moments can outweigh a strong advertised pay package.
The relevance of detention in particular is well established. ATRI’s 2024 work on the costs and consequences of truck driver detention underscores that detention remains a serious operational and financial burden for the industry 4. That supports what drivers have long known from experience: when dwell is treated casually, driver income and network efficiency both suffer. A carrier that aggressively documents detention, negotiates recovery, and pays drivers promptly sends a strong signal that driver time has value.
Transparent pay systems should therefore do three things at once. First, they should define the base method clearly, whether that is cents per mile, percentage, day rate, or another model. Second, they should spell out accessorial clocks and qualification rules in plain language. Third, they should publish a correction process with a response standard so drivers know what happens when something is wrong. Trust increases when drivers can see the policy, the math, and the remedy.
Why do payroll errors damage retention so quickly?
Payroll errors matter because they force drivers to relive operational failures after the work is already done. A missed pickup window is frustrating. A missed detention payment after that delay is demoralizing. By the time a settlement error appears, the driver has already absorbed the dwell, the schedule disruption, and often the parking or rest complication that came with it. If payroll then responds slowly or vaguely, the company appears indifferent to the cumulative cost of the problem.
Which Equipment and Maintenance Decisions Matter Most to Experienced Drivers?
Equipment is one of the clearest ways a carrier makes respect visible. Drivers experience equipment quality physically. They feel it in climate control during rest, in the dependability of the tractor, in the usability of cab features, and in how much downtime the week includes. A late-model truck does not automatically create loyalty, but unreliable equipment consistently destroys it.
Experienced drivers tend to care less about superficial features than about uptime, comfort, and repair discipline. They want preventive maintenance completed on schedule, fast roadside coordination, clear breakdown procedures, and a realistic plan for extended shop stays. If a truck goes down, they want one team to own the problem rather than multiple departments shifting responsibility. They also notice whether the carrier makes practical investments that help them recover properly between driving periods.
FMCSA’s fatigue guidance is relevant here as well. The agency connects impaired alertness with crash risk and stresses the importance of adequate rest 1. Equipment features that preserve rest—such as dependable HVAC, power systems, and sleepers that function as intended—support the same safety goals carriers claim to prioritize. In that sense, equipment quality is not just an asset utilization issue. It is a safety and retention issue.
Maintenance communication matters almost as much as maintenance itself. Drivers can tolerate a mechanical issue more easily than an information vacuum. If the repair process includes quick triage, clear status updates, realistic estimates, and a backup plan when delays extend, trust can survive the disruption. If the driver is left waiting on unclear approvals and repeated phone calls, a repair becomes a symbol of organizational disorder.
How Can Carriers Build a Safety-First Culture That Drivers Believe?
A real safety-first culture does not begin with posters or training decks. It begins when a driver encounters weather, fatigue, securement concerns, or customer pressure and can make the safer decision without fearing retaliation. Veteran drivers pay close attention to this because they know the difference between a company that says safety comes first and one that proves it when the load is at risk.
FMCSA’s fatigue material makes the stakes plain. Drowsiness can impair reaction time, and being awake for 18 hours may create impairment comparable to a blood alcohol concentration of 0.08 percent 1. Those findings are directly relevant to dispatch planning and driver communication. If a driver says a weather delay, parking shortage, or customer hold has created an unsafe situation, the company’s response becomes a test of whether safety is truly operationalized.
A believable safety culture has several characteristics. Drivers have explicit authority to stop or delay when conditions are unsafe. Safety holds are documented clearly in the operating system so payroll and customer service can respond without ambiguity. Preventable pressures, such as unrealistic appointment commitments or punitive treatment of late deliveries, are addressed at the planning level rather than pushed onto the driver. And when incidents or close calls occur, leaders focus on process improvement, not reflexive blame.
The connection to retention is straightforward. Experienced drivers want to work where their judgment is treated as an asset. If the carrier undermines that judgment whenever a shipment is urgent, the company sends the message that production matters more than professionalism. That message travels quickly through driver networks.
What makes safety culture credible instead of performative?
Credibility comes from consistent consequences and consistent protections. If a driver can document a weather hold and still receive fair treatment, the culture is credible. If a driver refuses an unsafe load and leadership backs that decision in practice, the culture is credible. If safety language disappears the moment service pressure rises, drivers conclude that the culture is decorative.
How Should Back-Office Support Be Organized So Driver Problems Get Solved Fast?
The best support model is not necessarily the one with the most departments. It is the one that resolves exceptions quickly without forcing the driver to navigate internal complexity. Breakdowns, lumper approvals, permit questions, missing purchase orders, detention disputes, and last-minute parking problems all test whether the carrier’s support structure is designed around driver time or around internal silos.
What experienced drivers want is simple: first-contact problem solving whenever possible. A centralized 24/7 support model can deliver that well if notes, approvals, and escalation paths are unified. A decentralized dispatcher-led model can also work when ownership remains clear and handoffs are disciplined. The wrong model is any model in which drivers must explain the same issue repeatedly to different people while the clock keeps running.
Parking is a useful example. FMCSA’s truck parking research specifically highlights the costs of driving extra miles to find legal parking, stopping early because spaces may disappear, or parking in unauthorized locations 3. If operations support is weak, those costs fall directly on the driver. If operations support is strong, the carrier actively helps the driver protect time, compliance, and safety.
Detention and lumper workflows reveal the same principle. Standing authority within clear limits often protects driver time better than repeated approval calls. A well-designed system documents the event, gets the driver moving, and handles cost recovery in the background. A poorly designed system saves pennies in control but loses hours in dwell.
How Should Carriers Use Technology Without Making Drivers Feel Surveilled?
Technology is valuable when it reduces friction. It becomes destructive when it creates additional clicks, duplicate data entry, false timestamps, or a sense that every tool exists mainly to monitor rather than support the driver. Experienced drivers tend to welcome useful technology and reject intrusive or unreliable technology. The distinction depends on how the tools are implemented.
A driver-centered technology stack does four things well. It works in weak-signal environments. It eliminates redundant entry across dispatch, compliance, scanning, and payroll tools. It captures documents cleanly enough to speed settlement. And it uses data for coaching and process improvement rather than surveillance theater. When technology does those things, drivers experience it as support. When it fails at them, it becomes another source of friction.
This matters for retention because the average driver does not judge technology by vendor promises. Drivers judge it by whether the app loads in the yard, whether geofencing creates false arrivals, whether they must retype the same trailer number in three systems, and whether a blurry document upload delays pay. In other words, they judge it the same way they judge every other part of the operation: by how it affects time, clarity, and income.
A disciplined rollout therefore requires field testing, fallback workflows, role-specific training, and adoption measures that actually reflect driver experience. The best tools become almost invisible because they quietly remove paperwork, phone tag, and settlement delays.
How Do Respect, Recognition, and Career Growth Keep Veteran Drivers From Leaving?
Recognition matters most when it is attached to real control, real listening, and real growth. Veteran drivers can usually tell the difference between recognition that reflects operational respect and recognition that tries to compensate for operational disorder. Awards, gift cards, and appreciation campaigns are not meaningless, but they do not outweigh chronic unpredictability, unresolved payroll issues, or repeated home-time misses.
The more durable form of respect is structural. Drivers feel respected when their judgment is trusted, when safety holds are not punished, when endorsements or training are supported, and when promotion paths are visible. They also feel respected when their experience influences policy through driver councils, feedback loops, or direct participation in customer and scheduling reviews.
Health and work-design evidence adds weight to this point. NIOSH’s survey of 1,670 long-haul truck drivers found that 69 percent were obese compared with 31 percent of U.S. working adults, 51 percent were current smokers compared with 19 percent of the general working population, and 14 percent reported diabetes compared with 7 percent in the general population 5. Those numbers do not mean carriers can solve every structural challenge of trucking. They do mean that the work environment carries long-term consequences. Respect therefore includes reducing avoidable stressors and giving drivers more control where possible.
Career growth should be treated the same way. Reimbursing endorsements, clarifying trainer or specialized-freight pathways, publishing time-to-promotion bands, and connecting recognition to measurable safety and service performance all tell experienced drivers that the company sees them as long-term professionals rather than temporary seat-fillers.
What Should Carriers Prioritize Over the Next 12 to 24 Months to Improve Driver Experience?
The next phase of competition for experienced truck drivers will be shaped less by recruiting creativity and more by operational proof. Information now travels quickly through reviews, referrals, driver communities, and publicly available safety and industry data. That means carriers cannot rely on broad brand claims for long. They have to show evidence that the driver experience they advertise is the one they deliver.
The most important strategic move is to make the driver experience observable. Track home-time compliance. Track first-contact resolution. Track time to payroll correction. Track breakdown turnaround. Track detention capture and payout speed. Track how often planning pushes drivers into avoidable parking pressure. Once those measures are visible, teams can stop arguing in abstractions and start improving the actual work.
The second priority is simplification. Many fleets do not need more initiatives; they need fewer conflicting processes. Communication standards, pay clarity, maintenance coordination, customer planning, and technology workflows should reinforce one another rather than create extra handoffs. Experienced drivers stay longer when the operation feels coherent.
The third priority is to use data to defend driver time. That means confronting chronic high-dwell customers, aligning appointments more realistically, documenting safety holds consistently, and using technology to reduce friction rather than increase oversight. The carrier that protects driver time will increasingly outperform the carrier that merely advertises appreciation.
What Is the Bottom Line for Carriers That Want to Keep Experienced Truck Drivers?
The bottom line is that experienced truck drivers are not asking for perfection. They are asking for coherence. They want to work in a system where communication is complete, scheduling is honest, pay is understandable, equipment is dependable, safety decisions are supported, and support teams solve problems without drama. When those pieces are present, a carrier feels professional. When they are missing, even strong recruiting copy or a competitive headline rate cannot fully compensate.
That is why the most effective retention strategy is not a single program but a better operating model. Every improvement that protects driver time, lowers uncertainty, and increases control strengthens the same message: this carrier understands how the job actually feels from the driver’s seat. For veteran drivers, that message is the difference between a company that sounds good and a company worth staying with.
FAQs About What Experienced Truck Drivers Expect From a Carrier
What do experienced truck drivers look for in a carrier first?
Most experienced truck drivers look first at how the company operates in real life. They want clear communication, predictable freight, accurate pay, reliable equipment, and support that solves problems quickly. Those daily operating signals tell them more than recruiting language ever will.
Why is home time so important for truck driver retention?
Home time matters because it represents honesty and control. Drivers can accept demanding work when they trust the plan, but repeated home-time misses signal that the operation is unstable or that driver commitments are easy to break. That damages retention quickly.
How does pay transparency affect experienced truck drivers?
Pay transparency reduces the distrust created by unclear settlements and unresolved accessorials. When drivers understand how they are paid, when detention starts, how corrections work, and when disputes will be resolved, they are far more likely to view the carrier as fair and professionally run.
What kind of communication do truck drivers prefer from dispatch?
Most prefer complete load briefs, exception-based updates, and a single source of truth for approvals and changes. They do not want constant interruptions or fragmented messages. They want timely, useful communication that helps them make good decisions on the road.
Can better technology really improve truck driver retention?
Yes, when the technology removes friction instead of adding it. Tools that reduce paperwork, prevent duplicate entry, improve document capture, and preserve clean settlement workflows can improve the driver experience materially. Technology that behaves like surveillance or fails in the field usually has the opposite effect.
How can a carrier show drivers real respect instead of symbolic recognition?
A carrier shows real respect by protecting driver time, backing safety decisions, keeping pay clean, supporting growth, and listening to experienced drivers when policies are reviewed. Symbolic recognition can help, but it cannot replace operational credibility.
Fuel sits near the top of a fleet’s operating costs, and small changes in semi truck fuel economy move real dollars. On typical long‑haul duty cycles, tractors average 6–8 MPG. At 100,000 miles a year and $4.00 diesel, improving from 6.5 to 7.5 MPG saves roughly $8,200 per tractor, without adding a single load.
The path to those gains is practical: plan smarter routes to cut out‑of‑route miles and idle, spec and retrofit proven aero and powertrain tech, coach drivers on steady speed and gentle inputs, and maintain tires, alignment, and aftertreatment to keep resistance low. Expect clear KPIs, MPG by lane and tractor, idle percentage, harsh events, supported by telematics, fuel card data, and simple ROI math so decisions stand up in a budget review.
Before prioritizing investments, align on the fundamentals, what efficiency measures mean, how they’re tracked, and which variables matter most. We’ll start with definitions and the core factors that raise or drag down MPG, then build toward the specific actions that deliver durable savings.
Why Fuel Is the Most Controllable Cost in Trucking
Fuel is one of the few major operating costs fleets can actively manage every day. When fuel economy is treated as a decision lens, rather than a number reviewed after the fact, it brings alignment across routing, equipment selection, driver behavior, and maintenance. This shift in perspective matters because even modest efficiency gains compound significantly across miles, trucks, and years, turning small improvements into meaningful financial outcomes.
Understanding Fuel as a Controllable Cost
Fuel becomes “controllable” not because of price at the pump, but because of the many operational choices that determine how many gallons are consumed per mile. Decisions around lane selection, departure timing, speed management, and idle policies all influence fuel use. Equipment specifications, such as aerodynamics and tire selection, also play a role, as do maintenance practices that ensure engines and tires operate at peak efficiency.
Industry data reinforces just how important this is. Studies from the American Transportation Research Institute consistently show fuel accounting for roughly one-quarter to one-third of total marginal costs. In periods of high diesel prices, it is often the single largest expense. In practical terms, a tractor running 100,000 miles per year at 6.5 MPG will consume about 15,400 gallons of fuel, costing roughly $61,600 annually at $4.00 per gallon. Improving efficiency to 7.5 MPG reduces consumption to about 13,300 gallons, creating substantial savings when scaled across an entire fleet.
Core Metrics and Operational Context
At the center of fuel management are two simple metrics: miles per gallon and gallons per 100 miles (G/100). MPG is familiar and effective for communicating performance trends, while G/100 offers a more operational perspective by translating efficiency directly into gallons consumed over distance. This makes it easier to connect performance improvements to real cost savings.
However, these metrics only become meaningful when viewed within the context of a truck’s duty cycle. Factors such as terrain, weather, speed, payload, and trailer type all influence what “good” fuel economy looks like. A long-haul highway operation will naturally produce different results than a regional or heavy-haul application, so performance targets must reflect real operating conditions.
The Four Levers That Drive Fuel Economy
With that context in place, fuel economy can be broken down into four primary areas of control. Routing and network decisions shape how much time trucks spend in congestion, how often they idle, and how many empty miles they run. Vehicle technology influences drag and rolling resistance, directly affecting efficiency at speed. Driver behavior determines how the powertrain is used in real-world conditions, especially in traffic and varying terrain. Finally, maintenance ensures that the efficiency built into the equipment is preserved over time.
Applying an ROI Mindset
To make fuel management actionable, fleets should approach every improvement as an investment. Whether it’s adjusting a route to avoid congestion or installing an aerodynamic device, each decision should be evaluated based on expected gallons saved, cost per gallon avoided, and overall payback period. These economics will vary depending on operating conditions, so what works in one fleet may not translate directly to another. The key is consistency, measuring fuel in gallons, translating it into dollars, and prioritizing actions based on clear financial returns.
How to Improve Semi Truck Fuel Economy and Cut Fuel Spend
With measurement and KPIs in place, the next step is to focus on where miles are actually driven and how time is spent on the road. Fuel waste tends to accumulate through congestion, idle time, inefficient routing, and empty miles. Addressing these at the network level is one of the fastest ways to improve semi truck fuel economy, because it removes waste before requiring new equipment or capital investment.
Time-of-Day Departures and Lane Selection
Small changes in departure timing can significantly reduce exposure to congestion. Shifting loads out of peak traffic windows helps minimize idle time and stop-and-go driving while maintaining service levels.
In a 50-load pilot out of Chicago, moving departures from 7:30 a.m. to 9:30–10:00 a.m.:
Reduced average idle by 32 minutes
Improved MPG from 6.9 to 7.3 (~6% gain)
Maintained on-time delivery
To scale this, use TMS data and historical traffic patterns to define preferred departure windows by lane, weekday, and season.
Planned Detours Around Bottlenecks
The shortest route is not always the most fuel-efficient. Consistent speeds often outperform stop-and-go traffic, even if the route is slightly longer.
Example:
8-mile detour at 7 MPG ≈ 1.14 gallons
Avoiding ~25 minutes of congestion can save:
0.4–0.6 gallons of idle fuel
Additional fuel lost to repeated acceleration
Pre-planning these detours improves both fuel efficiency and schedule reliability while reducing trip variability.
Dwell-Time Reduction and Appointment Discipline
Idle time at facilities is a hidden but significant fuel drain. Diesel engines typically consume ~0.8–1.1 gallons per hour at idle, meaning small reductions quickly add up.
Cutting 30 minutes of dwell across multiple weekly stops can:
Save 2–3 gallons per tractor per week
Reduce costs by ~$8–$12 weekly at $4.00/gal
Improve schedule predictability
Key tactics include:
Tighter, more realistic appointment windows
Increased use of drop-and-hook operations
Load pre-staging to reduce wait times
Geofenced alerts for early arrivals and extended dwell
Backhaul Planning to Reduce Empty Miles
Deadhead miles burn fuel without generating revenue, making them one of the most direct opportunities for improvement.
For example:
Reducing empty miles from 18% to 12% on 100,000 annual miles removes 6,000 empty miles
At 7 MPG, that’s ~857 gallons saved (~$3,400 annually at $4.00/gal)
Effective strategies include:
Securing consistent backhaul commitments
Multi-stop load consolidation
Regional lane swaps with partner fleets
Integrating load boards directly into the TMS
Fuel and Service Stop Strategy
Fuel stops should be planned as part of the route, not added as detours. Off-route fuel discounts can quickly be erased by the cost of getting there.
Example:
4-mile detour at 7 MPG ≈ 0.57 gallons burned
At a $0.10/gal discount, ~6 gallons must be purchased just to break even (before time costs)
Best practices:
Align fuel and rest stops with primary routes and HOS breaks
Use fuel price indexing to guide stop selection
Implement out-of-route alerts to reduce unnecessary deviations
By reducing congestion, idle time, and empty miles at the network level, fleets create fuel savings that repeat across every load. These operational improvements compound quickly and require little to no capital investment.
Once this waste is removed, the next step is to optimize the truck itself, focusing on aerodynamics and rolling resistance to further reduce fuel consumption.
Choosing the Right Aerodynamics and Rolling Resistance for Your Lanes
Once waste has been removed from routes and schedules, the next opportunity sits in how the truck interacts with air and pavement. Equipment decisions that shape airflow and tire contact determine how efficiently diesel energy is converted into forward motion. The goal is not to chase the newest or most aggressive add-on, but to match each choice to real operating conditions so projected gains translate into measurable savings.
Aerodynamics: Where Speed Changes the Equation
Aerodynamic drag increases rapidly with speed, which is why the same device can produce very different results depending on the lane. A long-haul truck cruising at 65 mph will see far greater benefit from aerodynamic improvements than a regional truck averaging 35–40 mph in stop-and-go traffic.
Common aerodynamic components work together to reduce turbulence and drag:
Trailer side skirts help smooth airflow beneath the trailer
Rear devices reduce wake drag behind the trailer
Tractor-trailer gap reducers and roof fairings limit turbulent air between units
Wheel covers minimize drag from rotating tires
In steady highway conditions, trailer skirts often deliver mid single-digit percentage fuel savings, with rear devices adding incremental gains when consistently deployed. These benefits are amplified in crosswind conditions, where managing airflow around the trailer becomes even more important.
Unlike aerodynamics, rolling resistance impacts fuel consumption at all speeds and becomes the dominant factor in lower-speed operations. Tires, alignment, and inflation determine how much energy is lost as the truck rolls down the road.
Low rolling resistance tires, particularly SmartWay-verified models, consistently deliver measurable improvements, often a few percentage points compared to standard options. These gains become even more reliable when paired with strong maintenance practices, including:
Proper tire inflation
Regular alignment checks
Monitoring uneven wear and tire condition
Wide-base single tires can provide additional efficiency gains in the right applications, but the decision should consider traction requirements, axle load limits, and service availability, not just headline fuel savings.
A useful rule of thumb:
Lower-speed or urban routes → prioritize tires and alignment
Higher-speed highway routes → aerodynamics take the lead
Putting Numbers to the Investment
To make these decisions actionable, fleets should evaluate improvements using lane-specific data. Start with a real baseline, MPG, annual miles, and fuel cost, then apply realistic savings assumptions.
Example scenario:
100,000 miles per year at 6.8 MPG
Diesel at $4.00 per gallon
Annual fuel use ≈ 14,706 gallons
If trailer skirts deliver a conservative 3% improvement on that lane:
Fuel saved ≈ 441 gallons annually
Cost savings ≈ $1,764 per year
With an installed cost of ~$1,200 (plus minor maintenance), the payback falls well under a year. However, on a low-speed urban route, that same investment would yield smaller savings and a longer return timeline, making tire upgrades a better initial priority.
Speed, Payload, and Seasonal Effects
Real-world performance depends on more than just equipment. Speed bands, payload, terrain, and weather all influence outcomes:
At 55–60 mph, aerodynamic gains are steady but moderate
At 65–70 mph, drag increases sharply, amplifying aero benefits
Heavier loads increase tire deformation, raising rolling resistance
Mountain routes introduce variability, with aero gains strongest on faster segments
Cold weather increases air density (helping aero slightly) but reduces tire pressure, increasing rolling resistance
Because of this, many fleets take a blended approach, standardizing low rolling resistance tires across all operations while concentrating aerodynamic investments on high-speed lanes.
Trailer Control and Real-World Execution
The effectiveness of aerodynamic investments often depends on trailer control. Fleets that rely heavily on drop-and-hook with third-party trailers may see limited returns from trailer-mounted devices. In these cases, tractor-based improvements, such as fairings and wheel covers, offer more consistent value.
Where fleets control their trailers, standardization becomes more viable, but execution matters. Savings can quickly erode if equipment is not maintained or used properly. Common issues include:
Damaged skirts from docks or snowbanks
Undeployed rear devices
Missing or worn aerodynamic components
Driver awareness and routine inspections play a critical role in preserving expected gains.
A Practical Payback Approach
A disciplined ROI framework keeps decisions grounded and repeatable:
Start with validated savings ranges from trusted sources or OEM data
Adjust expectations based on lane speed, weather, and trailer control
Convert percentage savings into gallons and dollars using real fleet data
Subtract maintenance and repair costs
Calculate payback period in months
As a general guideline, investments that return their cost within 12–24 months on target lanes should be prioritized. More uncertain cases can be piloted on a small subset of equipment before scaling.
Improving aerodynamics and reducing rolling resistance gives the truck a more efficient physical profile, lowering the energy required for every mile traveled. But hardware alone is not enough. To fully capture these gains, the powertrain must deliver torque efficiently and consistently under real-world conditions.
How to Configure Powertrains and Intelligent Controls for Better MPG
Powertrain settings determine how efficiently every drop of diesel is converted into motion. Improving fuel economy is not just about hardware, it is equally about how that hardware is configured and controlled. Gearing, shift logic, and speed policies can either turn terrain into usable momentum or waste energy through unnecessary braking, excess RPM, and inefficient acceleration. The goal is to translate these engineering levers into practical, repeatable settings that fleets can actively manage.
A real-world example illustrates how quickly these changes can add up. Midwest Refrigerated, operating 120 tractors, piloted three adjustments on its primary I-70 corridor: reducing governed speed from 68 to 65 mph, enabling predictive cruise with eCoast on rolling terrain, and updating AMT shift logic for earlier upshifts. Over 90 days and more than 6 million miles, fuel economy improved from 6.8 to 7.3 MPG, about a 7% gain, without impacting on-time delivery. Most of the improvement came from maintaining steady speeds and using terrain more effectively.
Governed Speed: Balancing Fuel and Time
Speed is one of the most direct and controllable drivers of fuel consumption. Even small reductions can produce meaningful savings:
Reducing top speed by 3 mph typically saves 3–5% in fuel
Adds roughly 3 minutes per 100 miles in transit time
Schedule impact is minimal when appointments reflect the new operating speed
In practice, governed speed changes often deliver the largest single gain, especially on long-haul lanes where trucks spend extended time at cruise.
Downspeeding and Driveline Matching
Downspeeding, running the engine at lower RPM while maintaining road speed, requires the right combination of engine, axle ratio, and tire size. When properly matched, it keeps the engine operating in its most efficient range.
Flat, highway-heavy routes → favor taller gearing for lower RPM
Routes with frequent 3–5% grades → maintain enough ratio to avoid engine lugging
The key is balance: pushing RPM too low in hilly terrain can force excessive downshifting, negating efficiency gains.
Automated Manual Transmissions: Consistency at Scale
AMTs reduce variability between drivers and ensure consistent, fuel-efficient shifting. When calibrated correctly, they:
Promote earlier upshifts and lower average RPM
Skip gears when load and terrain allow
Deliver typical fuel savings of 1–3% over manual transmissions
In the Midwest Refrigerated pilot, updated shift maps, favoring earlier upshifts and smoother torque delivery, produced measurable MPG gains while improving drivability.
Predictive Cruise and eCoast: Using Terrain as an Asset
Modern cruise systems leverage GPS and topographic data to optimize speed and momentum automatically. These systems:
Slightly increase speed before climbs
Reduce throttle near hill crests
Coast on gentle descents to conserve fuel
On rolling terrain, fleets often see 1–4% fuel savings. In the pilot program, these features contributed a meaningful portion of the overall improvement, particularly on long, undulating highway segments.
Torque and Acceleration Management
Short bursts of aggressive acceleration can consume disproportionate amounts of fuel without improving overall trip time. Managing torque delivery helps smooth these inefficiencies:
Limit peak torque in lower gears to reduce fuel spikes
Use progressive pedal mapping to smooth acceleration
Set grade-hold thresholds to avoid unnecessary downshifts
These adjustments reduce high-RPM events that quietly erode fuel economy over time.
Calibration Governance: Turning Changes Into Standards
To ensure lasting impact, powertrain settings should be managed with the same discipline as any operational policy. A structured approach includes:
Testing one variable at a time
Tracking MPG normalized for payload, terrain, and weather
Using telematics data for weekly performance reviews
Publishing validated configurations as standard profiles
In the example fleet, a controlled pilot group and consistent data review allowed leadership to confirm results before scaling changes across the operation.
Dialing in powertrain settings and intelligent controls establishes a reliable efficiency baseline that drivers can consistently achieve. With diesel configurations optimized, the next step is to evaluate where alternative fuels and electrified solutions fit within your network, based on lane structure, dwell time, and infrastructure readiness.
How to Train and Coach Drivers for Better Fuel Economy
Even the best equipment and routing strategies will fall short if driver programs are not designed thoughtfully. In many fleets, the biggest gaps in fuel economy come not from technology limitations, but from how performance is measured, coached, and incentivized. The most common issues are not obvious at first, they stem from misaligned metrics, inconsistent follow-through, or incentives that unintentionally encourage the wrong behaviors. Addressing these pitfalls is what turns short-term gains into durable, fleet-wide improvements.
Apples-to-Oranges Driver Comparisons
One of the most common mistakes is ranking drivers using raw MPG without accounting for operating conditions. A driver hauling heavy loads through mountain terrain cannot reasonably compete with one running lighter freight on flat highways. When comparisons feel unfair, drivers disengage because the outcome appears outside their control.
To correct this, performance should be normalized across comparable conditions. Group drivers by lane type, payload range, terrain, and even seasonal factors, then evaluate performance within those cohorts. Metrics like gallons per 100 miles, idle percentage, overspeed time, and cruise utilization provide a more accurate picture. Just as importantly, recognize improvement trends, not just top performers, so every driver has a clear, achievable path to success.
One-and-Done Training with No Follow-Through
Initial training programs often fade quickly without reinforcement. Drivers may complete onboarding or annual refreshers, but without consistent coaching, habits drift and newer features, such as predictive cruise or optimized AMT settings, go underutilized.
A more effective approach is to build a regular coaching rhythm. Short monthly refreshers, combined with targeted ride-alongs or simulator sessions, help reinforce high-impact behaviors like steady throttle control and anticipatory braking. Telematics data can guide quick microlearning sessions tied to recent exceptions. Assigning one clear goal per driver each month, such as reducing time above a certain speed, keeps the focus manageable and measurable, while short check-ins ensure accountability.
Punitive Leaderboards That Backfire
Public rankings and winner-take-all incentives can unintentionally drive unsafe or counterproductive behavior. Drivers may attempt to “game” the system, coasting in neutral, avoiding necessary HVAC use, or taking other risks, to improve their numbers. This not only undermines safety but can damage morale and retention.
A more sustainable model balances fuel efficiency with safety and service metrics. Coaching should be private and constructive, while rewards can be structured around team or cohort improvement. Clear guardrails are essential: explicitly prohibit unsafe practices such as drafting or neutral coasting, and allow for documented exceptions when conditions like weather or heavy loads impact performance.
Ignoring Feature Utilization and Configuration Gaps
Scorecards often highlight low usage of features like cruise control without addressing whether drivers understand how to use them, or whether the truck is configured correctly. Differences across model years can further complicate adoption.
Closing this gap requires truck-specific training and clear in-cab guidance. Demonstrate how features like predictive cruise behave on real routes, then track usage metrics such as time in cruise or fuel-saving modes. At the same time, verify that vehicle settings, like cruise offsets or engine brake configurations, support the behaviors being encouraged. Alignment between training and configuration is critical for consistent results.
Fuel Targets That Conflict with Operations
Fuel goals that ignore real-world constraints can create tension between efficiency and service. A strict speed cap or aggressive MPG target may not be realistic for lanes with tight delivery windows or high-speed traffic flow, leading drivers to either miss appointments or disregard the policy altogether.
The solution is to align fuel targets with operational planning. Work with dispatch to define speed ranges by lane, adjust departure times where needed, and measure performance within those parameters. Tracking “time in target speed range” is often more practical than enforcing a single hard limit, allowing drivers to balance efficiency with on-time delivery.
Over-Focusing on MPG Instead of Behavior
MPG is an important outcome, but it is influenced by many external factors such as weather, terrain, and freight mix. Focusing solely on this number can obscure the behaviors that actually drive improvement.
A stronger approach combines outcome metrics with behavior-based indicators. Track MPG and gallons per 100 miles, but coach drivers on controllable actions like idle time, acceleration patterns, and gear usage. Many fleets see a significant performance gap between top and bottom drivers operating under similar conditions. Closing that gap starts with identifying and coaching the specific behaviors that create it.
Avoiding these common pitfalls makes driver performance programs more credible, actionable, and fair. When drivers understand expectations, trust the measurement system, and receive consistent coaching, they are far more likely to adopt fuel-efficient habits. The result is a tighter alignment between the truck’s technical capabilities and real-world performance, delivering steady, repeatable gains in fuel economy across the fleet.
Semi Truck Fuel Economy: FAQs
What is semi truck fuel economy, and why is it controllable?
Semi truck fuel economy, typically measured in miles per gallon, reflects how far a truck can travel on a gallon of diesel. What makes it especially important is that it is highly controllable. Unlike fuel prices, which fluctuate externally, fuel consumption is driven by daily operational decisions, routing, speed, idle time, driver behavior, equipment specifications, and maintenance.
Even small improvements compound quickly. For example, increasing efficiency from 6.5 to 7.5 MPG over 100,000 miles at $4.00 per gallon saves roughly $8,200 per truck annually. When fleets treat fuel economy as a decision-making lens rather than a passive result, they gain direct control over one of their largest operating costs.
MPG vs. Gallons per 100 Miles: When to Use Each
MPG is the most familiar metric and works well for tracking performance trends and communicating results. However, gallons per 100 miles (G/100) provides a more operational perspective by showing how much fuel is actually consumed over a fixed distance.
For example:
6.8 MPG ≈ 14.7 G/100
This makes it easier to calculate savings and ROI. MPG is best for high-level reporting, while G/100 is more useful for day-to-day decision-making and evaluating improvements in terms of gallons and dollars.
What factors influence fuel use?
Fuel consumption is shaped by four core areas:
Routing and network design: congestion, idle time, empty miles, and out-of-route driving
Vehicle technology: aerodynamics and rolling resistance
Driver behavior: speed, throttle control, and cruise usage
Maintenance: tire condition, alignment, engine performance, and aftertreatment systems
Each of these factors can either reinforce or erode fuel efficiency, depending on how they are managed.
How do you build a practical fuel efficiency plan?
Improving fuel economy starts with consistent measurement and a structured approach:
Track MPG and G/100 alongside key context metrics like idle rate, overspeed time, and cruise utilization
Remove network inefficiencies first by optimizing routes, departure times, dwell, and empty miles
Match equipment to operating conditions, tires and alignment for lower-speed routes, aerodynamics for highway lanes
Configure powertrains with appropriate speed policies, gearing, and shift logic
Reinforce improvements through driver coaching and consistent maintenance
An ROI mindset, measuring gallons saved and cost per mile, keeps efforts focused and scalable.
What are the benefits and tradeoffs of aerodynamic upgrades?
Aerodynamic improvements reduce drag and are most effective at higher, steady speeds. Common upgrades include trailer skirts, rear devices, gap reducers, roof fairings, and wheel covers.
On long-haul routes:
Trailer skirts can deliver mid single-digit percentage fuel savings
Rear devices add incremental gains when consistently deployed
However, these upgrades come with tradeoffs: potential damage, the need for proper usage (especially rear devices), and reduced effectiveness on low-speed urban routes. If trailer control is limited, tractor-based aerodynamic improvements often provide more reliable returns.
How does rolling resistance affect fuel economy?
Rolling resistance is the energy lost as tires interact with the road, and it impacts fuel use at all speeds, especially in lower-speed operations where aerodynamics matter less.
Key practices to reduce rolling resistance include:
Using low rolling resistance, SmartWay-verified tires
Maintaining proper tire inflation
Performing regular alignment checks
Addressing uneven wear early
Wide-base single tires can offer additional gains in certain applications, but decisions should factor in traction, load limits, and service availability.
How do speed policies and powertrain choices impact fuel use?
Speed is one of the most influential variables in fuel consumption. Reducing governed speed by just a few miles per hour can cut fuel use by 3–5%, with minimal schedule impact when operations are aligned.
Other key factors include:
Downspeeding: lowering engine RPM with matched gearing for efficient cruising
Shift logic and calibration: ensuring the engine operates in its optimal range
The best results come from aligning speed policies, gearing, and transmission behavior with real-world operating conditions.
What makes a driver performance program effective?
A strong driver program is built on fairness, clarity, and consistency. Comparing drivers without context, such as lane type or payload, leads to disengagement. Instead, normalize performance by operating conditions and focus on behaviors drivers can control.
Effective programs:
Track both outcomes (MPG, G/100) and behaviors (idle, speed, acceleration)
Use private, constructive coaching rather than public rankings
Set one clear, achievable goal per driver at a time
Align incentives with safety and on-time performance
Clear guardrails should also prevent unsafe practices like drafting or neutral coasting.
What misconceptions limit fuel savings?
Several common assumptions can hold fleets back:
Believing fuel costs are mostly driven by pump price rather than controllable usage
Assuming the shortest route is always the most efficient
Ranking drivers by raw MPG without context
Relying on one-time training instead of ongoing coaching
Chasing off-route fuel discounts that are offset by extra miles
A more effective approach focuses on controllable gallons per mile, steady-speed routing, normalized performance metrics, and consistent driver engagement.
What trends are shaping fuel efficiency in trucking?
Fuel efficiency is increasingly driven by technology and data. Advances in predictive cruise, eCoast, and refined transmission logic are delivering steady gains without major hardware changes. Tire technology, TPMS, and alignment analytics are helping fleets manage rolling resistance more precisely.
At the same time:
Telematics are enabling more accurate ROI tracking and decision-making
Alternative fuels and electrification are growing where infrastructure and duty cycles allow
Diesel optimization remains the fastest, most reliable path to savings for many fleets
The overall trend is clear: fleets that combine data, technology, and disciplined execution are achieving the most consistent improvements in fuel economy.
Most buyers start with the sticker on the window, but the number that matters is the total you’ll actually pay and what it will cost to run the truck over time. In other words, a semi’s “price” has layers: the quoted build price, the out-the-door total, and the long-run operating cost. Understanding those layers turns the broad question “how much is a semi truck” into a specific, workable budget.
Think of the purchase in two steps. First is the out-the-door amount: the negotiated truck price plus mandated charges and local costs. Second is total cost of ownership, which captures everything the truck will cost over the years you run it. Together, they define the real price of your truck.
Semi Truck Cost: Sticker, Out-the-Door, and Total Cost of Ownership
The out-the-door total starts with the negotiated price and adds the fees required to get the truck on the road. For new heavy-duty tractors, federal excise tax of 12 percent applies, and most states add sales or use tax. You’ll also see title and registration fees, and interstate carriers typically pay for apportioned plates under the International Registration Plan. Dealers may add documentation or delivery fees. If you buy in a state without sales tax but register the truck at home, expect your state to assess use tax at registration. Two quotes with the same sticker can land thousands apart at delivery simply because state tax rates, local add-ons, and fee structures differ.
Total Cost of Ownership
TCO captures the full cost of running the truck over its service life. It includes:
Fuel and diesel exhaust fluid
Routine and unscheduled maintenance
Tires
Insurance
Permits and tolls
Compliance costs, including the annual Heavy Vehicle Use Tax
Financing interest or lease charges
Telematics and ELD services
Depreciation minus eventual resale value
Your spec choices change both the upfront and operational sides. The right configuration depends on your routes, payload, and business goals, not just the lowest initial price.
How Much Is a Semi Truck? The Spec Decisions That Set the Price
Sticker prices vary widely based on how you configure the tractor for your freight, terrain, and duty cycle. To truly answer how much is a semi truck for your operation, map each spec choice to its impact on upfront price, fuel economy, payload, uptime, and resale. The right build for the long haul will differ from a dump or mixer, even if the cab looks similar.
Sleeper vs. Day Cab and Comfort Packages
A sleeper generally adds about 30,000–60,000 dollars over an equivalent day cab, and premium interiors and storage can add another 10,000–30,000. Idle‑reduction equipment such as an auxiliary power unit typically runs 8,000–12,000 dollars yet can save 1,500–3,000 gallons of diesel per year during long‑haul rest breaks while reducing engine hours and wear. Expect a modest weight penalty of roughly 500–1,000 pounds, which matters on high‑payload routes.
On‑Highway Aero vs. Vocational Heavy Spec
Highway tractors use aerodynamic bumpers, chassis fairings, and low‑rolling‑resistance tires to gain about 0.5–1.5 MPG at speed. Vocational frames emphasize durability, ride height, approach angles, and PTO provisions. Heavy‑duty axles, suspensions, frame reinforcements, and protective hardware suitable for job sites can add 20,000–60,000 dollars over an aero on‑highway build. Spec for where the truck will actually work: a sleek bumper is expensive if it keeps getting torn off at a quarry, while skipping aero costs money on every interstate mile.
Engine Size, Aftertreatment, and Transmission Choice
Higher‑displacement engines and higher horsepower ratings usually add 5,000–15,000 dollars but help hold cruise speed on grades and can extend component life at 80,000 pounds GCWR and above. Automated manual transmissions tend to add 3,000–7,000 dollars compared with manuals, often returning 1–3 percent better fuel economy and simplifying driver onboarding. They also pair well with downspeeding to keep RPM lower at cruise. Modern diesels come with DPF/SCR aftertreatment as standard; quality fuel and consistent maintenance reduce regen‑related downtime and help protect resale.
Axle Count, Ratios, Lift Axles, and Wheelbase
Moving from a simple tandem to configurations with lift or pusher axles can add 8,000–20,000 dollars, trading spec cost for legal payload and bridge law compliance. Axle ratios tuned to your cruise speed and terrain meaningfully influence fuel burn: a taller ratio helps on the interstate but can lug on steep routes unless matched to the engine’s torque curve. Wheelbase affects weight distribution, ride quality, and turning radius. Extremely long or highly specialized wheelbases can limit future buyers and soften resale.
Safety Tech and Driver‑Assist Packages
Collision mitigation, active braking, lane departure alerts, and 360‑camera systems typically add 8,000–12,000 dollars. Many insurers recognize these features with premium credits or lower deductibles, and larger fleets increasingly expect them on used units, which supports resale value. Beyond crash avoidance, adaptive cruise and stability control reduce fatigue and incidents that cause costly downtime.
Electrical Power, HVAC, and Vocational Upfits
Inverters, extra batteries, bunk HVAC, and higher‑output alternators often total 1,000–6,000 dollars, improving off‑grid comfort and protecting sensitive electronics. Vocational PTOs, wet kits, and body‑builder provisions commonly add 5,000–25,000 dollars. Plan for accessory loads and duty cycle early so wiring, fusing, and battery capacity match real usage and integration is done right the first time.
Put the Pieces Together With Lane Math
When you combine these choices, the picture gets clearer. A long‑haul aero sleeper with safety tech might cost 40,000–70,000 dollars more than a regional day cab, yet at 100,000 highway miles per year, a 1.0 MPG advantage plus modest insurance savings can recoup roughly 6,000–12,000 dollars annually and strengthen resale later. With equipment mapped to the job, the next lever is location: state taxes, fees, and compliance can shift both the out‑the‑door price and ongoing operating costs.
How State Taxes and Fees Change Your Semi’s Out-the-Door Price
The check you write at delivery isn’t just the truck’s sticker plus a generic tax line. Where you title and operate that tractor can move your first-year total by five figures because states layer sales or use tax, apportioned registration, local fees, and special highway programs on top of the federal rules. Even buyers who try to purchase in a no‑sales‑tax state usually settle up when they register at home. Understanding this geography is the difference between a pleasant surprise and an avoidable overrun.
The Federal Baseline: 12% FET
Every new Class 8 starts with the same federal baseline: a 12% Federal Excise Tax on the selling price of a qualifying heavy truck. On a $200,000 invoice, that adds $24,000 before any state math. From there, state rules diverge. Some states have no general sales tax on equipment, while others layer a state rate with county or city add‑ons that push the effective rate above 9%. In many jurisdictions, sales or use tax applies to the full taxable selling price and certain fees; in others, it excludes specific line items. The result is that two buyers paying the same negotiated truck price can see very different out‑the‑door totals based solely on the registration address.
Apportioned Registration Under IRP
For interstate carriers, apportioned registration under the International Registration Plan is the next big lever. Unlike a flat plate, IRP fees are apportioned by your declared operation across member jurisdictions and scaled by weight. That means the same tractor plated for 80,000 pounds can cost more or less to register depending on your base state and where you run miles. For a new on‑highway sleeper, first‑year IRP and plate charges commonly land in the low four figures, but ranges are normal because weights, miles, and local supplements vary. Plan early with your base state’s IRP unit, fees, documents, and timelines differ and can affect when your truck actually enters service.
What the Numbers Look Like: Texas, California, and Oregon
On a $200,000 new sleeper, a buyer registering in Texas typically sees the $24,000 FET plus roughly 6.25% state sales tax on the taxable amount, about $12,500 before local particulars. Add title, inspection, and apportioned registration that might total around $1,200–$1,800 for an 80,000‑lb declaration, and the Texas out‑the‑door can finish near $38,000–$40,000 above the selling price.
In California, the same truck starts with the same FET, then picks up a higher combined state‑and‑local sales/use tax (often 8%–10% depending on locality), plus weight‑based registration charges. In practice, that can place a comparable first‑year stack closer to the mid‑$40,000s above the selling price, with the exact figure hinging on county and how the taxable base is computed.
Oregon illustrates the opposite approach. With no general sales tax, the out‑the‑door is often much closer to $24,000–$28,000 above the selling price after FET and registration. But that lighter day‑one bill comes with a different meter running: Oregon’s weight‑mile tax applies as you operate, shifting cost from the invoice to the per‑mile column.
A common misconception deserves a quick note: buying the truck in a low‑tax state rarely “wins” if your home state imposes use tax. Most DMVs assess use tax at registration to equalize the result.
Ongoing State and Federal Programs That Add Cost
Beyond the purchase, several programs continue charging as you turn miles. These don’t show up on the sales quote but can add meaningful pennies per mile or recurring annual costs.
Oregon’s weight‑mile tax, New York’s Highway Use Tax, Kentucky’s KYU, and New Mexico’s weight‑distance tax can apply based on your routes and weight.
Some states and counties assess annual personal property tax on business equipment, including tractors.
Environmental and compliance regimes matter. In California, the Air Resources Board has engine‑year cutoffs and fleet requirements that affect what you can register and where you can operate.
Regardless of state, the federal Heavy Vehicle Use Tax of up to $550 per year applies to vehicles 55,000 pounds and up; you need the IRS‑stamped Schedule 1 from your Form 2290 filing to complete IRP or registration renewals.
How to Plan and Verify Your Costs
To avoid surprises, confirm each piece of the stack before you close.
Ask the selling dealer for a line‑item estimate that separates the taxable base, FET, sales/use tax assumptions, and every fee.
Confirm with your base state IRP office whether sales or use tax is computed on a price that includes FET and options, what documents you need for apportioned plates, and whether local property tax applies to rolling stock.
If you domicile in one state but primarily run in another, model both the upfront stack and the per‑mile obligations tied to your lanes.
If you plan an out‑of‑state closing to chase a lower tax line, verify whether your home state will assess use tax when you register, most will.
From Upfront Costs to Total Cost of Ownership
After you clear FET, sales/use tax, plates, and permits, the meter keeps running every time the truck moves. That is why the next step is to look at total cost of ownership, fuel, maintenance, tires, insurance, and downtime, because that per‑mile reality, more than any sales‑tax quirk, is what ultimately answers how much a semi truck is for your business.
Total Cost of Ownership: Semi Truck Cost per Mile Explained
Over three to seven years, operating cost per mile determines whether a truck makes money. The real number lives in fuel, maintenance, tires, insurance, compliance, downtime, and depreciation, expressed in cents per mile. Get those inputs right and the window sticker matters far less.
A straightforward TCO model converts each line into cents per mile and annual dollars. With that view, trade-offs such as new versus used, aero versus classic, and extended warranty versus a self-funded reserve become clear.
Fuel and MPG Drive the Biggest Swings
Every 0.5 MPG change at 100,000 miles can move annual fuel cost by roughly $3,000 to $6,000 depending on diesel price. In Darren’s case, the 0.7 MPG difference pencils to about $5,800 a year, often enough to justify paying slightly more upfront for the more efficient spec, provided it’s reliable on his routes.
Maintenance and Tires: Plan in Cents per Mile
A practical reserve for a modern Class 8 tractor is commonly 7–15 cents per mile for maintenance and 2–4 cents for tires, trending lower on newer units and higher on high-mileage used equipment. Darren’s 11 cpm maintenance and 3 cpm tires total $14,000 per year. If he chose an older tractor, he would model 12–16 cpm for maintenance plus a larger unplanned repair buffer.
Insurance and Safety Tech Affect Cash Flow
Owner-operator insurance can range widely, think 8–20 cents per mile based on operating radius, cargo, and driving history. Darren’s 14 cpm improves by 1–2 cpm when he adds forward-collision mitigation and dash cams, which many carriers and insurers recognize with lower premiums.
Compliance and Fees: Small but Certain
Line items like Heavy Vehicle Use Tax, apportioned registration under IRP, ELD subscriptions, and permits usually total 1–3 cents per mile. Darren e-files HVUT before plate renewal and budgets another 0.5–1.0 cpm for tolls on his lanes.
Downtime, Warranty, and Parts Strategy
A day out of service can mean $1,000–$1,500 in lost revenue, so coverage choices matter. Darren prices an extended aftertreatment warranty against a self-funded reserve; the warranty reduces tail risk, while disciplined PM intervals and stocking critical spares help avoid costly road calls.
Residual Value and Exit Plan
Depreciation often exceeds any single operating line in the early years. Darren models resale at year five and finds that a more efficient, well-documented spec with safety tech may retain several cents per mile in value, lowering true ownership cost at exit.
Put It All in a Simple TCO Spreadsheet
Build a one-page model that lists each cost in cents per mile and annual dollars at your expected mileage. Update it as fuel prices, lanes, and maintenance history change. With this TCO view in hand, you can compare new, used, and certified pre-owned options with confidence and choose the spec that delivers the best semi truck cost per mile for your business.
New vs. Used vs. Certified Pre-Owned: Price, Risk, and Uptime
Choosing between a new, used, or certified pre-owned Class 8 tractor isn’t just about the sticker price. It’s a trade-off between capital outlay, uptime, fuel efficiency, warranty coverage, and regulatory access. The right pick depends on how many miles you run, how critical uninterrupted uptime is to your business, and whether you operate in states with tighter emissions rules. Thinking in total cost per mile helps clarify the options, and the choice you make will shape cash flow and risk over the next three to seven years.
Buying New: Warranty, Aerodynamics, and Fuel Economy
A new on-highway sleeper typically carries the highest purchase price but pairs it with factory warranty, the latest emissions hardware, improved aerodynamics, and often advanced safety tech. That combination can lower unplanned repairs and help with insurance eligibility and driver comfort. Fuel economy is the big lever: a 1.0 MPG advantage at 100,000 miles per year saves roughly 2,000 gallons annually. At diesel between $3 and $5 per gallon, that’s about $6,000–$10,000 per year, often enough to offset around $25,000 in higher upfront price over roughly three years while also supporting stronger resale. The trade-offs are higher early-year depreciation, the need for more cash or financing capacity, and potential lead time if you need a specific spec.
Going Used: Lower Price, Higher Maintenance Risk
A non-CPO used tractor meaningfully reduces capital cost and often avoids the 12% Federal Excise Tax applied to new heavy-duty trucks, but it shifts more risk to maintenance and downtime. Owners commonly set aside 10–12 cents per mile for maintenance on older equipment to cover aftertreatment work, sensors, tires, and wear components, with the understanding that a single out-of-warranty repair can erase months of savings. Downtime also carries opportunity cost, lost loads, missed delivery windows, and potential penalties, so used equipment works best for operators who maintain a higher cash reserve, can plan preventive maintenance tightly, and have flexibility when a truck is out of service.
Certified Pre-Owned: Middle Ground with Warranty Support
Certified pre-owned sits between the two. You get a lower entry price than new and, in many cases, immediate availability, plus the assurance of a comprehensive inspection and a limited powertrain warranty. That warranty can cap some catastrophic risk on engines or transmissions and may also help with lender comfort, though consumables and many emissions components may still be your responsibility. MPG typically trails the newest aero specs, and you won’t capture the full benefit of the latest driver-assist packages. For many lanes, the value lies in stabilizing repair exposure without paying new-truck money.
Where and How You Run
Two factors often break the tie in practice: where you run and how hard you run. If you operate in states with stricter emissions programs, such as California’s CARB rules that limit older engines, a newer model year may be necessary to access key markets and ports. And if your business runs 90,000–120,000 miles a year with tight delivery windows, the uptime, fuel savings, and warranty support of a new or late-model CPO unit can out-earn a cheaper older tractor. Conversely, if your profile is regional, seasonal, or vocational with lower annual miles and more shop flexibility, a well-vetted used unit, ideally with telematics history and recent aftertreatment service, can deliver strong value.
Make the Decision with TCO Math
The real answer comes down to two numbers: what it takes to get the title and plates today, and what each mile costs you tomorrow. That means your negotiated price plus taxes and fees to get on the road, think 12% FET, sales or use tax, IRP plates, paired with a disciplined TCO that translates fuel, maintenance, insurance, and resale into cents per mile. Spec choices and base state affect both: aero or vocational, engine and transmission, safety technology, and even wheelbase shape MPG, uptime, and residual value, while state programs change your day‑one bill and ongoing obligations. If you want clarity on how much is a semi truck for your operation, build a simple TCO worksheet, confirm tax and registration with your base state, and price the spec that matches your lanes, not just the sticker.
FAQ: How Much is a Semi Truck?
What are the key layers of a semi truck’s price?
The total price of a semi truck comes in three layers, each building on the last. The sticker price is the negotiated cost of the truck itself, including the base build and selected options. From there, the out-the-door total adds mandatory charges such as the 12% Federal Excise Tax (FET), state sales or use tax, title and registration, apportioned plates under IRP, and dealer fees.
Beyond the purchase, total cost of ownership (TCO) captures what the truck costs to operate over time. This includes fuel and DEF, maintenance, tires, insurance, permits and tolls, compliance costs like HVUT (Form 2290), financing or lease payments, telematics/ELD services, and depreciation minus resale value. Together, these layers define both your upfront investment and your long-term cost per mile.
How does total cost of ownership (TCO) work?
TCO converts all ongoing expenses into annual dollars and cents per mile, making it easier to compare different truck specs or purchasing strategies. It includes:
Fuel and DEF
Maintenance (scheduled and unscheduled)
Tires
Insurance
Permits, tolls, and compliance fees (including HVUT)
Financing interest or lease costs
Telematics and ELD subscriptions
Depreciation offset by resale value
By standardizing costs this way, TCO reveals which truck configuration is actually more profitable, not just which one is cheaper upfront.
How do truck configurations affect price, MPG, and resale?
Truck specifications have a direct impact on both cost and performance. A sleeper cab typically adds $30,000–$60,000 compared to a day cab, while premium interiors can add another $10,000–$30,000. Auxiliary power units (APUs), costing $8,000–$12,000, can significantly reduce idle fuel consumption in long-haul operations.
Aerodynamic, on-highway trucks generally deliver better fuel economy, often improving MPG by 0.5–1.5 at highway speeds, while vocational trucks prioritize durability and may cost $20,000–$60,000 more. Powertrain choices also matter: higher horsepower engines add $5,000–$15,000, and automated manual transmissions (AMTs), typically $3,000–$7,000, can improve fuel economy by 1%–3%. Well-balanced specs tend to hold resale value better because they appeal to a broader range of secondary buyers.
What drives fuel efficiency and cost per mile?
Fuel efficiency is influenced by a combination of equipment and operations, including aerodynamics, tire rolling resistance, axle ratios, transmission type, engine settings, payload, terrain, idle time, and driver behavior.
Even small MPG changes have a meaningful financial impact:
A 0.5 MPG improvement at 100,000 miles can shift annual fuel costs by roughly $3,000–$6,000
A 0.7 MPG difference at $4.25 per gallon equals about $5,800 annually
Because fuel is often the largest variable expense, these changes directly affect profitability on a cents-per-mile basis.
How do taxes and registration affect the out-the-door price?
Taxes and fees can add significantly to the purchase price of a semi truck. Every new Class 8 truck is subject to a 12% Federal Excise Tax, followed by state sales or use tax, title and registration fees, and dealer charges. Interstate carriers must also account for apportioned plates under the International Registration Plan (IRP), which vary based on weight and mileage.
Costs differ widely by state. On a $200,000 truck:
Texas may add ~$38,000–$40,000
California can reach the mid-$40,000s
Oregon may be lower upfront ($24,000–$28,000) but applies weight-mile taxes later
Importantly, purchasing in a low-tax state does not typically eliminate tax liability, most states assess use tax when the vehicle is registered.
What are the pros and cons of new vs. used vs. certified trucks?
Each option offers a different balance of cost, risk, and performance:
New trucks: Higher upfront cost, but include warranty coverage, modern technology, and better fuel efficiency (often saving ~2,000 gallons annually with a 1.0 MPG advantage)
Used trucks: Lower purchase price and often no FET, but higher maintenance risk and potential downtime
Certified pre-owned: Middle ground with inspections and limited warranties, though typically less efficient than new models
The right choice depends on your operating lanes, uptime requirements, emissions regulations, and available capital.
What safety features are available, and do they matter financially?
Modern trucks offer advanced safety systems such as collision mitigation with active braking, lane departure warnings, adaptive cruise control, stability systems, and 360-degree cameras. These packages typically cost $8,000–$12,000 upfront.
While optional, they often:
Reduce accident frequency and downtime
Lower driver fatigue
Qualify for insurance discounts or improved terms
Increase resale value as fleets expect these features
A new career in weeks, not years, with pay tied directly to real freight demand is what draws thousands of people to the driver’s seat every year. If you’re considering becoming a truck driver, you probably want clear, straightforward answers: the exact steps involved, how long the process takes, what it costs, and what life on the road is actually like.
This guide provides those answers with a compliance-first perspective.
What You’ll Learn
FMCSA eligibility requirements
DOT medical standards
Drug and Alcohol Clearinghouse requirements
CDL endorsements that unlock higher-paying freight
Training options and financing possibilities
What recruiters look for when hiring new drivers
Earnings and Career Path
You’ll also learn about realistic driver earnings and the typical career progression, from starting as a company driver to eventually operating your own trucking business. Understanding this path helps set accurate expectations and prevents costly mistakes early in your career.
The Basic Path to Becoming a Truck Driver
The process becomes straightforward when you follow the correct sequence:
Confirm eligibility requirements
Complete CDL training
Pass required testing and certifications
Secure your first driving position
Starting with the fundamentals, eligibility, training, and testing, sets you up to begin driving safely, legally, and confidently on your first miles.
Is Truck Driving Right for You? The Work, Mindset, and Who Succeeds
Before investing in training, evaluate whether trucking fits your work style and lifestyle expectations. Trucking is a skilled and highly regulated profession that offers independence, but it also carries significant responsibility. The best fit involves more than simply enjoying driving.
What the Work Feels Like: Miles, Schedules, and Home Time
Most new drivers begin with over-the-road (OTR) positions that involve multi-state routes and staying out one to three weeks at a time, followed by two to three days at home. Carriers typically schedule 2,000–2,800 miles per week for solo OTR drivers. Regional routes generally allow drivers to return home weekly but may include slightly fewer miles. Local routes provide daily home time but usually involve more stops and tighter schedules. These work rhythms directly influence earnings, sleep patterns, and family routines, so it is important to be realistic about what schedule you can maintain.
The Driver Mindset: Independence, Planning, and Patience
Drivers who succeed often enjoy working independently, following structured procedures, and solving problems calmly. The job requires managing traffic stress, planning ahead for fuel stops, parking, and weather conditions, and maintaining composure when delays occur. Individuals who value predictable routines, clear rules, and the satisfaction of completing a task often find the culture of trucking rewarding.
Safety First, Always: The Record That Builds Your Career
In trucking, your safety record determines future opportunities. Hours-of-Service rules, electronic logging devices, pre-trip inspections, load securement practices, and speed management are essential parts of the job. These procedures protect your commercial driver’s license and ensure freight moves safely and legally. A clean motor vehicle record can lead to better routes, higher-paying freight, and faster advancement.
Beyond Driving: Service, Communication, and Reputation
Professional drivers do more than operate a truck. They communicate with dispatch teams, arrive on time for shipper and receiver appointments, and represent their carrier at loading docks and yards. Courtesy, accurate paperwork, and well-maintained equipment often translate into more consistent miles and better load assignments.
Who Succeeds in Trucking: Backgrounds and Strengths That Translate
Certain professional backgrounds adapt well to trucking. Veterans often thrive because they are accustomed to procedures, equipment maintenance, and structured operations. Tradespeople and individuals with warehouse or delivery experience frequently transition smoothly because they understand freight handling and schedule discipline. Some parents begin in OTR roles to build experience before moving into regional or dedicated lanes that provide more predictable home time.
Earnings and Outlook: Industry Demand and Pay Expectations
Trucking carries the majority of freight in the United States, creating steady demand for qualified drivers. According to the American Trucking Associations, trucks move most domestic freight tonnage in the country. Data from the Bureau of Labor Statistics shows that median annual pay for heavy and tractor-trailer truck drivers sits in the low $50,000 range, with higher earnings tied to safe driving records, endorsements, and specialized freight. Drivers who maintain strong performance often gain faster pay increases, improved equipment, and additional compensation tied to productivity.
What Can Disqualify You, and How to Address It
Certain issues may temporarily prevent someone from entering the industry. Recent DUIs, major traffic violations, or a pattern of accidents may require waiting periods before carriers will consider an application. Medical conditions such as untreated sleep apnea may also require documented treatment before qualifying for a DOT medical card. Reputable training schools and carriers can clarify their lookback periods and explain what documentation or timeframes are needed to become eligible.
How to Get Your CDL: From Permit to Skills Test, Start to Finish
The process of earning a commercial driver’s license follows a clear sequence: qualify, learn, practice, test, and onboard with a carrier. For anyone planning to become a truck driver, understanding this roadmap prevents confusion and helps you move through each requirement efficiently. While minor details vary by state or training provider, the overall structure is consistent nationwide because it is based on federal regulations.
Eligibility First: Age Rules and the DOT Medical Card
The CDL journey begins with eligibility. Drivers can operate commercial vehicles within their state at age 18, but interstate driving requires a minimum age of 21. Before taking written CDL exams, you must complete a Department of Transportation physical exam with a certified medical examiner. This evaluation confirms that you meet the vision, hearing, and overall health standards required for commercial drivers.
After the exam, you receive a Medical Examiner’s Certificate, commonly called a DOT medical card. Drivers managing medical conditions such as sleep apnea or diabetes may need additional documentation or proof of treatment. Preparing this information in advance can prevent delays in the licensing process.
Earning Your CLP: Written Tests and ELDT Theory Basics
Once you have your medical card, the next step is obtaining a Commercial Learner’s Permit (CLP). This permit allows you to practice driving a commercial vehicle while supervised by a qualified CDL holder.
To earn the permit, you must study your state CDL manual and pass written knowledge tests. Most future tractor-trailer drivers pursue a Class A CDL, which requires passing the general knowledge test along with combination vehicle and air brake exams. Class B licenses focus on straight trucks and buses, but Class A offers broader job opportunities across the trucking industry.
After passing the written tests, new federal regulations require completion of Entry-Level Driver Training (ELDT). All CDL applicants must complete both theory instruction and behind-the-wheel training with a provider listed in the Federal Motor Carrier Safety Administration’s Training Provider Registry.
Behind the Wheel: Range Drills and Real-World Road Practice
ELDT programs combine classroom knowledge with practical driving experience. The theory portion covers key safety and compliance topics including vehicle systems, hours-of-service rules, trip planning, hazard awareness, and space management.
Behind-the-wheel training begins on a controlled range and gradually progresses to public roads. Students learn to perform detailed pre-trip inspections, control the truck and trailer during backing maneuvers, and operate safely in real traffic environments. Core skills include straight-line backing, offset backing, and alley dock setups. High-quality training programs emphasize meaningful driving time and structured coaching rather than minimal practice.
Skills Test Essentials: Pre-Trip, Basic Control, and Road Driving
The CDL skills test consists of three main segments. The first portion is the pre-trip inspection. During this step, applicants must identify vehicle components, explain their functions, and check for potential safety defects.
The second segment focuses on basic control skills in a closed course. Drivers demonstrate maneuvers such as straight-line backing, offset backing, and either parallel parking or alley docking depending on state requirements. Precision and patience are more important than speed.
The final stage is the road test. Applicants drive in normal traffic while demonstrating safe lane control, proper mirror use, speed management, and correct turning techniques so the trailer tracks safely around corners and curbs. Many trainees practice narrating their observations to stay focused and anticipate potential hazards.
After You Pass: Adding Endorsements and Clearing Hiring Checks
Once you pass the skills test, you officially earn your CDL. At this point, endorsements allow you to expand the types of freight you can haul. A tanker endorsement allows transportation of liquid loads, doubles and triples endorsements apply to certain less-than-truckload operations, and a hazardous materials endorsement allows drivers to transport regulated cargo after completing a Transportation Security Administration background check.
Many drivers choose the combined tanker and hazardous materials endorsement to broaden their job options. Because hazmat endorsements require fingerprints and background screening, the process may take several additional weeks.
From CDL to Carrier: Screenings, Orientation, and Trainer Time
After licensing, hiring processes typically include several compliance checks. Carriers review records in the FMCSA Drug and Alcohol Clearinghouse, conduct a pre-employment drug test, and examine your motor vehicle record and work history.
Orientation introduces new drivers to company policies, electronic logging systems, and cargo securement standards. Many carriers also assign new drivers to work with experienced trainers for several weeks. This on-the-job training helps new drivers develop consistent habits, refine trip planning skills, and build confidence in real operating conditions.
What Truck Drivers Do Day to Day: Routes, Freight, and Schedules
Trucking is not a single job. The day-to-day experience varies based on route length, freight type, and how much control you have over your schedule. Understanding how these factors shape a typical week helps you evaluate the lifestyle as well as the earning potential.
Segments and Schedules
Different trucking segments create different weekly rhythms. Over-the-road drivers often run 2,500 to 3,000 miles per week with multi-day trips and extended time away from home. Regional drivers usually average 1,800 to 2,400 miles and return home weekly. Local drivers may run 1,200 to 1,800 miles but complete many stops during daily shifts and typically return home each night.
Freight Type Changes Your Day
The type of freight you haul also shapes your daily responsibilities. Dry van freight generally requires less physical work but may involve longer wait times at shipping docks. Flatbed hauling includes tasks such as tarping and load securement, which increase physical effort and often pay higher rates. Tanker driving demands smooth vehicle control and strict safety procedures because of the nature of liquid cargo.
Equipment and Technology Define Workflow
Modern tractors rely heavily on technology. Electronic logging devices track hours-of-service compliance, in-cab navigation assists with route planning, and many trucks use automatic transmissions. Sleeper cabs often include auxiliary power units or power inverters that support cooking appliances, climate control, and rest during off-duty hours.
Time Management Is the Job
A large part of professional driving is managing time effectively. Drivers must plan their routes around the federal 11-hour driving limit within a 14-hour on-duty window. They also account for parking availability, fuel stops, and shipping or receiving appointment times.
Relationships Drive Consistency
Driver relationships with dispatchers and customers play an important role in job stability. Dedicated accounts provide familiar routes, predictable schedules, and repeated visits to the same shipping locations. Spot freight operations may offer higher pay during strong freight
How to Choose a CDL School: Program Types, Quality Checks, and Veteran Paths
Where and how you train influences your early driving experience and your long-term earning potential. When evaluating CDL training programs, focus on quality indicators, total cost, and job placement outcomes rather than choosing a program based solely on speed or upfront tuition.
Accreditation and ELDT Compliance
Ensure the training provider appears in the Federal Motor Carrier Safety Administration Training Provider Registry. Schools listed in this registry meet Entry-Level Driver Training requirements for classroom instruction and behind-the-wheel driving. Programs outside the registry may delay your ability to schedule a CDL skills test or secure employment.
Instructor Ratios and Real Driving Time
Look for training programs with no more than four students per instructor during range practice and road driving sessions. Quality programs typically provide 30 to 40 hours of actual driving within a 160 to 200 hour course. Review the school’s syllabus to confirm that behind-the-wheel training is clearly defined rather than replaced by ride-alongs or simulator sessions.
Equipment Quality and Test Access
Training on modern equipment helps students develop realistic driving skills. Ideally, programs should provide late-model tractors and standard 53-foot trailers similar to those used in commercial operations. Ask whether the CDL skills test will be conducted using the same equipment used during training. Schools that offer on-site third-party testing often reduce scheduling delays and allow students to test with familiar vehicles.
Job Placement Outcomes and Carrier Partnerships
Review each school’s job placement statistics, including the percentage of graduates hired and the average time between graduation and first driving assignment. Programs that maintain relationships with multiple carriers may provide more job options and help align graduates with employers offering preferred schedules, such as regional routes with weekly home time.
Total Cost of Attendance and Funding Options
When comparing programs, calculate the full cost of attendance. This may include tuition, testing fees, DOT physical exams, permit and license fees, endorsement costs, basic gear, and lost income during training. Financial assistance may be available through workforce development programs, grants, employer sponsorships, or veterans education benefits.
Veteran Training Paths and Apprenticeships
Veterans should verify whether a program accepts GI Bill funding or participates in apprenticeship programs that provide structured pay increases during the first year of employment. Military vehicle experience may also help some applicants transition more quickly into commercial driving roles.
Choosing the right CDL training program helps you build safe driving habits, pass the CDL skills test sooner, and begin your career with a carrier that matches your lifestyle and income goals. The next step is evaluating the financial side of training so you can choose the program that delivers the strongest return on investment.
Truck Driver Benefits Compared: Pay, Home Time, and Long-Term Security
Choosing trucking as a career usually involves weighing several advantages rather than focusing on one single benefit. Earnings, lifestyle flexibility, and long-term stability all play a role. The decision becomes clearer when you evaluate trucking across three main factors: income potential, time and lifestyle, and control over your career path.
Earnings Potential Across Trucking Roles
Income varies based on route type, freight specialization, and experience level. Many new over-the-road drivers begin with consistent weekly mileage, often around 2,500 to 3,000 miles, with pay that increases relatively quickly during the first year. Regional routes typically offer slightly lower mileage but provide more predictable home time while still including additional pay for delays, layovers, or special handling.
Local driving roles frequently pay hourly and may include overtime, allowing drivers to return home every day. However, total weekly income may be somewhat lower if overtime opportunities are limited. Specialized freight often raises earning potential. Flatbed drivers may receive additional pay for tasks such as tarping and load securement, while tanker or hazardous materials endorsements can add further pay premiums.
Compared with many four-year degree paths, trucking can offer a faster return on investment. Training programs commonly last between six and ten weeks, after which new drivers can begin earning income within a few months rather than waiting years to enter the workforce.
Time and Lifestyle Trade-Offs
Work schedules vary significantly depending on the type of trucking job. Over-the-road positions may require two to three weeks away from home followed by several days off. This schedule offers travel variety and long-distance driving but requires extended time away from family or personal commitments.
Regional positions generally allow drivers to return home weekly and operate on familiar routes. This provides a balance between steady mileage and more predictable routines. Local driving roles allow drivers to return home each night, which can be ideal for maintaining family schedules. However, these jobs often include heavier city traffic, more frequent stops, and earlier start times.
A common comparison might look like this: an OTR driver may earn more during a strong mileage week but miss a weekend event, while a regional driver might earn slightly less yet maintain consistent weekly home time.
Stability and Job Security
Freight demand fluctuates with economic conditions, but drivers with clean motor vehicle records and strong safety histories tend to remain employable across market cycles. Additional endorsements can expand job opportunities if certain freight sectors slow down.
Company driving positions often include benefits such as health insurance, retirement contributions, paid time off, and maintained equipment. Drivers working under percentage-of-load pay structures may earn more during strong freight markets but must be comfortable with income variability.
While automation continues to develop within transportation, many aspects of trucking, such as safety decision-making, weather response, and interaction with shipping facilities, still require skilled human drivers. Industry projections suggest gradual technological changes rather than immediate large-scale replacement of drivers.
Control and Career Flexibility
One of the long-term advantages of trucking is the ability to choose different career paths within the industry. Company drivers typically receive steady pay, equipment maintenance, and administrative support. This structure allows drivers to focus primarily on safe operation and freight delivery.
Owner-operators gain greater control over routes, freight selection, and business decisions. They may also benefit from business tax deductions and higher revenue potential. However, they also assume responsibility for fuel costs, insurance, equipment maintenance, and periods of downtime when trucks require repairs.
Many drivers begin their careers as company employees, gaining experience and building savings before deciding whether to transition into operating their own trucking business.
Matching the Benefits to Your Goals
The most valuable benefit of trucking depends on personal priorities. Some drivers prioritize higher earning potential, while others focus on predictable home time or long-term independence. Matching the right trucking segment and pay model to your current life stage can make the career far more sustainable.
Drivers who invest in endorsements, maintain strong safety records, and build experience across different freight types keep more opportunities available as their careers progress.
Will Self-Driving Trucks Replace Drivers? What the Next Decade Really Looks Like
Concerns about automation often appear in conversations about trucking careers. Headlines about autonomous truck pilots can make it seem as though human drivers may soon be replaced. In reality, current technology demonstrations operate in limited environments and do not represent the complexity of the national freight network.
Where Autonomous Truck Technology Works Today
Most autonomous trucking projects operate under tightly controlled conditions. These tests usually occur on specific highway corridors with favorable weather, well-mapped routes, and limited traffic complexity. Even in these scenarios, many operations still involve safety drivers, remote monitoring teams, or escort vehicles.
These pilot programs often avoid dense urban areas, unpredictable weather conditions, and complicated loading facilities. While the technology can demonstrate highway driving capabilities, it still struggles with many real-world challenges encountered in everyday freight operations.
The Parts of the Job Automation Cannot Easily Replace
Professional truck drivers do much more than steer a vehicle down a highway. Their responsibilities include conducting pre-trip inspections, securing loads, navigating crowded shipping facilities, communicating with dispatchers and customers, and responding to unexpected road or equipment issues.
Freight pickups and deliveries frequently involve busy distribution centers, narrow docks, and changing schedules. These environments require judgment, communication, and adaptability, skills that current autonomous systems are not designed to manage independently.
Industry Adoption Remains Gradual
Autonomous truck technology continues to develop, but widespread deployment faces several obstacles. Insurance liability, regulatory approvals, and safety validation remain major considerations. Shippers and carriers must also ensure that automated systems can operate safely in mixed traffic environments that include passenger vehicles, construction zones, and unpredictable road conditions.
At the same time, the trucking workforce continues to experience steady demand. Retirements, freight growth, and specialized freight sectors create ongoing hiring needs for qualified commercial drivers.
Specialized Skills Increase Long-Term Stability
Drivers who develop specialized skills tend to remain especially valuable within the industry. Freight segments such as tanker, hazardous materials, and flatbed require hands-on expertise in load handling, safety procedures, and compliance practices.
These tasks occur outside the truck itself and rely heavily on human judgment. Because of this, specialized freight roles are less likely to be affected by automation developments in the near future.
Technology as a Tool, Not a Replacement
Rather than replacing drivers entirely, many emerging technologies are designed to assist them. Driver-assistance systems, advanced navigation tools, and safety monitoring systems help improve efficiency and reduce risk. Professional drivers who become comfortable using these technologies can benefit from safer operations and more efficient route management.
For individuals considering a career in trucking, the key question is not whether automation will eliminate driving jobs but how technology will change the way drivers work. By maintaining a strong safety record, gaining endorsements, and staying adaptable as technology evolves, drivers can remain valuable contributors to the freight industry for years to come.
Looking Ahead in Trucking: A Practical Map from First Job to Lasting Career
The decisions you make during your first few years in trucking can shape your opportunities for the next decade. Freight patterns, technology, and regulatory expectations continue to evolve, but one constant remains: drivers with strong safety records and professional habits maintain the most control over their careers. Treating your CDL as a professional credential, not just a job requirement, helps you build long-term value in the industry.
Freight Markets That Are Growing
Freight movement patterns are shifting due to manufacturing growth, nearshoring, and expanding distribution networks. Several highway corridors have become increasingly important for trucking operations. Routes running through the Texas Triangle, including Interstate 35 and Interstate 45, support heavy freight volumes tied to manufacturing and distribution. Interstate corridors such as I-10, I-20, I-65, and I-75 also connect key industrial regions from the Southeast to the Midwest.
At the same time, e-commerce and logistics hubs continue to grow around major cities such as Dallas–Fort Worth, Atlanta, Chicago, the Inland Empire in Southern California, Columbus, and Memphis. These hubs support regional, dedicated, and intermodal freight operations. For drivers, this means greater opportunities for consistent lanes, predictable schedules, and home time through dedicated routes or local distribution work.
Aligning your endorsements and experience with these freight markets can strengthen your long-term career prospects. Tanker endorsements may open opportunities in Gulf Coast chemical corridors, refrigerated freight is common around major food distribution centers, and hazardous materials endorsements can expand options near industrial shipping hubs.
Technology in the Modern Trucking Workplace
Technology continues to play a larger role in day-to-day trucking operations. Electronic logging devices have become standard, and many fleets now use telematics systems that monitor driving performance, fuel efficiency, and safety metrics.
Modern trucks often include safety technologies such as collision mitigation systems, lane departure alerts, and speed management tools. Many fleets also use inward- and outward-facing cameras to support driver coaching and safety verification.
Drivers who are comfortable using onboard technology, communicating schedule updates through fleet management systems, and maintaining strong safety scores often gain access to better routes and more competitive pay packages.
While autonomous trucking technology continues to develop, its current applications remain limited to controlled pilot projects on specific highway corridors. In the near term, most trucking jobs will still rely heavily on human drivers, especially roles involving urban deliveries, specialized freight, and customer-facing responsibilities.
Compliance as a Career Advantage
Regulatory compliance plays a major role in long-term career stability. Maintaining a clean record in the Drug and Alcohol Clearinghouse, following hours-of-service regulations, and passing roadside inspections consistently help protect your professional reputation.
For drivers who eventually plan to become owner-operators, building strong compliance habits early is especially important. Tracking fuel usage for International Fuel Tax Agreement reporting, maintaining accurate records, and filing required tax forms such as Heavy Vehicle Use Tax each year can prevent costly penalties and downtime.
Successful drivers often treat their career like a small business. Tracking cost per mile, monitoring fuel efficiency, and setting aside funds for equipment maintenance all contribute to long-term financial stability. Many experienced owner-operators recommend maintaining a maintenance reserve of approximately ten to fifteen cents per mile to prepare for unexpected repairs.
Turning Strategy Into Action
A durable trucking career comes from combining safe driving habits with strategic career decisions. Drivers who build endorsements, maintain strong safety scores, and develop experience in freight markets with consistent demand often gain greater flexibility when choosing employers or negotiating compensation.
The most practical strategy is simple: focus on safe performance, learn the business side of trucking early, and remain adaptable as technology and freight networks evolve. By doing so, your CDL becomes more than a license, it becomes a long-term professional asset that continues to create opportunities throughout your career.
Truck Driver Career FAQ
What are the main steps to become a commercial truck driver, from meeting requirements to landing the first job?
Start by confirming eligibility. You must be at least 18 to drive commercially within your state and 21 to drive across state lines, and you must pass a DOT medical exam to obtain a valid medical card. Next, study for and pass the written knowledge exams required to obtain a Commercial Learner’s Permit. After receiving your permit, complete Entry-Level Driver Training that includes both classroom instruction and behind-the-wheel driving practice.
Once training is complete, you must pass the CDL skills test, which includes a pre-trip inspection, basic vehicle control maneuvers, and an on-road driving exam. Drivers can then add endorsements for specialized freight if desired, and those pursuing hazardous materials endorsements must complete Transportation Security Administration background screening. The final step is completing carrier hiring checks, attending company orientation, and driving with a trainer before operating solo.
What is a commercial driver’s license, and how do the permit, training, and skills tests work?
A commercial driver’s license (CDL) allows individuals to operate commercial motor vehicles. The most common license for tractor-trailer drivers is a Class A CDL, while Class B licenses typically apply to straight trucks and buses. To begin the process, applicants obtain a Commercial Learner’s Permit by passing written knowledge tests covering topics such as general trucking knowledge, combination vehicles, and air brake systems.
After receiving the permit, applicants complete Entry-Level Driver Training with a registered training provider. This training includes safety theory instruction and practical driving experience. To earn the CDL, candidates must pass a three-part skills test that includes a pre-trip inspection, a basic vehicle control test, and a road driving exam.
How do over-the-road, regional, and local trucking jobs differ in duties, schedules, and lifestyle?
Over-the-road drivers typically run long-distance routes across multiple states, often driving 2,000 to 3,000 miles per week. These jobs usually involve staying on the road for one to three weeks before returning home for several days.
Regional trucking positions generally involve shorter routes within a specific region and usually allow drivers to return home weekly. Local trucking jobs provide daily home time but often involve more stops, tighter delivery schedules, and driving in busy urban areas. Because of the increased number of stops, local routes may involve fewer total miles compared with OTR jobs.
What endorsements can drivers add to a CDL, and how do these affect freight options and earning potential?
Common CDL endorsements include tanker (N), doubles and triples (T), and hazardous materials (H). Many drivers pursue the combined tanker and hazardous materials endorsement (X) because it expands the types of freight they can haul.
These endorsements can open opportunities in specialized freight sectors that often offer higher pay due to increased safety requirements and additional responsibility. Obtaining a hazardous materials endorsement requires fingerprinting and a Transportation Security Administration background check, which can take several weeks to complete.
What safety and compliance practices do professional drivers follow, and how do they impact career opportunities?
Professional truck drivers follow strict safety and compliance practices that protect both their licenses and their career prospects. These include complying with Hours-of-Service regulations using electronic logging devices, conducting thorough pre-trip inspections, properly securing cargo, and maintaining safe speeds and following distances in traffic.
Drivers must also maintain a clean motor vehicle record and remain compliant with federal programs such as the Drug and Alcohol Clearinghouse. Drivers who consistently demonstrate safe driving habits often gain access to better routes, more reliable freight, and higher-paying opportunities.
How do company driver positions compare with owner-operator paths in responsibilities, risks, and control?
Company drivers typically receive steady pay, employee benefits, and equipment maintained by the carrier. This structure allows them to focus primarily on safe driving and freight delivery without managing business expenses.
Owner-operators operate as independent businesses. They have greater control over the freight they haul and the routes they run but also assume responsibility for costs such as fuel, insurance, maintenance, and equipment financing. Owner-operators must also manage administrative tasks including fuel tax reporting and filing annual Heavy Vehicle Use Tax forms to keep their equipment compliant.
What does a realistic trucking career progression look like, and what choices help drivers advance?
Many drivers begin their careers as company over-the-road drivers to gain experience and establish a strong safety record. After building experience, they may add endorsements and transition into regional or dedicated routes that offer improved home time.
Some drivers move into specialized freight sectors such as flatbed, tanker, or refrigerated hauling to increase earnings and develop specialized skills. Others eventually become owner-operators after gaining industry knowledge and saving funds to support the financial responsibilities of operating their own trucking business.
What are common myths about self-driving trucks, and what role will human drivers likely play over the next decade?
One common misconception is that self-driving trucks will soon replace human drivers. In reality, most autonomous trucking tests occur on limited highway routes and still involve safety drivers or remote monitoring.
Many aspects of trucking—such as navigating shipping docks, handling urban traffic, inspecting equipment, and communicating with customers—require human judgment and adaptability. Because of these factors, automation is expected to supplement drivers rather than replace them in the foreseeable future.
How can I evaluate a CDL training program for quality, cost, and job placement outcomes?
When evaluating a CDL training program, confirm that the school is listed in the Federal Motor Carrier Safety Administration Training Provider Registry so it meets Entry-Level Driver Training requirements. Ask about instructor-to-student ratios and the number of actual driving hours provided, ensuring that the program emphasizes real behind-the-wheel practice.
You should also review equipment quality, test scheduling availability, and job placement outcomes. Programs with on-site testing and relationships with multiple carriers often help graduates enter the workforce more quickly. Compare the total cost of training, including exams, endorsements, gear, and lost income during training, and explore funding options such as workforce grants or veterans education benefits.
What industry trends are shaping trucking today, and what skills and habits help drivers stay in demand?
Freight demand continues to grow along major transportation corridors and near logistics hubs across the United States. Fleets increasingly rely on technologies such as electronic logging devices, telematics systems, and safety monitoring tools.
Drivers who maintain strong safety records, become comfortable using onboard technology, and add specialized endorsements tend to remain highly employable. Understanding compliance requirements, managing time effectively, and maintaining accurate documentation all contribute to long-term career stability and earning potential.
A truck can only earn what its numbers allow. A monthly payment between $2,000 and $3,500 can influence cost per mile more than almost any other expense. In a market where fuel prices shift weekly and freight rates can soften without warning, owners need more than loan approval, they need a financial plan. When approached carefully, commercial truck financing can support stable cash flow and long-term equity instead of creating financial strain.
Before choosing a financing option, map out your financial picture. Estimate gross versus net income, track both fixed and variable operating costs, and calculate an all-in cost per mile. Establish a minimum rate per mile that covers expenses and protects profit margins. Align your insurance coverage with contract requirements and build reserves for maintenance, taxes, and unexpected downtime.
Once your operating numbers are clear, compare financing structures carefully. Evaluate loans and leases based on annual percentage rate, loan term, required down payment, fees, and prepayment conditions. Stress-test potential payments against realistic assumptions for weekly miles, fuel costs, and freight rates to confirm that the truck can remain profitable under different market conditions.
Credit readiness, complete documentation, and the condition of the truck itself will influence the financing terms available. Understanding these factors ahead of time helps borrowers secure better rates and avoid surprises during the approval process.
The next step is understanding the core financing structures available, loans and leases, and how each option affects monthly cash flow, tax treatment, and long-term ownership equity.
How to Map Trucking Revenue: From Gross to True Net per Mile
Miles alone do not pay the bills, revenue does. Before pricing loads confidently or deciding how large a truck payment your business can support, you need a clear picture of every revenue source and how it translates into net income per mile. The objective is to convert complex settlements into consistent, comparable numbers you can manage.
Start with a few core definitions. Gross revenue includes everything billed to the customer or shown on your settlement: linehaul pay, fuel surcharge, and accessorial charges such as detention, layover, or extra stops. Net to truck is the amount remaining after marketplace, brokerage, dispatch, or factoring fees and any chargebacks. True net is what remains after all operating expenses; this section previews the concept before the next section formalizes the full cost structure.
How to Map Linehaul, Surcharge, and Accessorials Step by Step
Revenue moves through a predictable sequence. Linehaul covers the actual transportation of freight and fluctuates with freight demand. Fuel surcharge is generally a pass-through mechanism tied to published diesel averages, designed to offset changes in fuel costs rather than create additional profit. Accessorial charges compensate for operational delays or additional work, such as detention at shipping docks, lumper services, driver assistance, or extra stops along a route.
How to Use RPM and Net per Mile to Set Profitable Rates
Two key metrics help drivers and fleet owners evaluate performance clearly. Rate per mile (RPM) equals total gross revenue divided by dispatched miles and reflects the strength of the top-line revenue. Net per mile (NPM) begins with net-to-truck revenue and ultimately accounts for operating costs to reveal how much income remains for taxes, loan payments, and owner compensation.
Worked Example: Converting Monthly Revenue to Per-Mile Performance
Consider a scenario where a driver runs 9,800 dispatched miles in a month. Linehaul averages $2.05 per mile, producing $20,090 in revenue. Fuel surcharge averages $0.45 per mile, generating $4,410, while accessorial charges total $540. Combined gross revenue reaches $25,040, which equals $2.55 RPM.
Next, calculate net to truck. If brokerage or factoring fees equal 5 percent of gross revenue ($1,252) and chargebacks total $200, the driver receives $23,588 before operating expenses. On a per-mile basis, this equals approximately $2.41 per mile before costs.
From Gross Revenue to True Net
Operating costs determine the final profitability. Industry data from the American Transportation Research Institute reported average marginal operating costs around $2.25 per mile in 2022, driven largely by fuel, equipment, and maintenance expenses. If a driver’s actual operating costs averaged near that level across 9,800 miles, total monthly costs would reach roughly $22,060. Subtracting that from $23,588 leaves about $1,528 for the month, or roughly $0.16 per mile in true net income.
How Lane Mix Affects Revenue Stability
The structure of your freight lanes can influence income stability. A lane paying $1.60 linehaul with a $0.70 fuel surcharge can maintain relatively stable gross revenue when diesel prices rise because the surcharge increases with fuel costs. In contrast, a flat $2.30 linehaul with a minimal $0.10 surcharge may appear similar at current fuel prices but provides less protection if diesel costs spike.
How Fuel Programs Change Your Real Net per Mile
Fuel discounts and fuel efficiency also affect profitability. If a driver receives a $0.35-per-gallon discount through a fuel card network and the truck averages 7.5 miles per gallon, the actual fuel cost per mile may fall below what the surcharge assumed, creating additional profit. Conversely, purchasing fuel at retail prices outside discount networks can quickly erode margins.
Converting Revenue Into Per-Mile Terms
To manage a trucking business effectively, express both revenue and costs in the same units. Weekly or monthly totals help with cash planning, but per-mile calculations allow meaningful comparisons between lanes, brokers, and seasons. When evaluating truck financing, convert the monthly payment into a per-mile figure and include it in the same calculation so your minimum rate stays aligned with real operating costs.
How to Build a Trucking Cost Architecture You Can Actually Manage
Profit in trucking does not come from a single good week or a strong settlement. It comes from consistently measuring and organizing costs so that every financial decision supports long-term stability. A structured cost system separates expenses into clear categories, converts them into per-mile and weekly values, and uses those numbers to establish pricing floors and maintenance planning.
Fixed, Variable, and Semi-Variable Costs Defined
Costs fall into three main categories. Fixed costs remain constant regardless of miles driven, including truck payments, insurance, permits, ELD subscriptions, and parking. Variable costs increase with miles driven, such as fuel, DEF, maintenance, tires, and mileage-based tolls. Semi-variable costs fluctuate depending on route choices or operating conditions, including toll-heavy lanes, paid parking, and certain delivery-related expenses.
Accurate classification prevents mistakes such as underpricing loads during slow weeks or assuming profits during high-mileage months that may not reflect long-term averages.
Standardize Costs to Per-Mile and Per-Week Metrics
Every expense should be expressed in both cents per mile and weekly totals. For example, $4,800 in fixed monthly expenses equals 48 CPM at 10,000 miles, but increases to 60 CPM if monthly miles fall to 8,000. When viewed weekly, the same cost equals about $1,200 per week, which highlights how quickly fixed expenses accumulate during downtime.
Create a Simple Chart of Accounts
A practical accounting structure keeps expenses easy to track. Typical categories include revenue sources such as linehaul, fuel surcharge, and accessorials; fixed costs such as truck payments and insurance; variable costs like fuel and maintenance; and reserve categories for maintenance, tires, downtime, and taxes. Every expense should fit clearly within this structure so spending patterns remain visible.
Fuel Is a System, Not Just a Receipt
Fuel cost management depends on both price per gallon and fuel efficiency. At $4.25 per gallon, a truck averaging 6.5 MPG costs about 65 CPM in fuel, while a truck averaging 7.5 MPG costs around 57 CPM. That 8 CPM difference equals roughly $800 per month at 10,000 miles, which can exceed the cost of equipment upgrades such as auxiliary power units or low-rolling-resistance tires.
Maintenance Reserves by Equipment Age
Maintenance reserves should increase as trucks age. Newer equipment under warranty may require 8–10 CPM in maintenance reserves. Trucks three to five years old often require 12–15 CPM, while older, high-mileage equipment may need 18–25 CPM. At 10,000 miles per month, a 15 CPM reserve equals $1,500, turning unexpected repairs into manageable expenses rather than financial emergencies.
Treat Tires as a Planned Expense
Tires should be managed like a sinking fund rather than an unexpected cost. A $4,000 tire set lasting 150,000 miles equals about 2.7 CPM, and adding balancing, rotations, and alignment increases the realistic planning figure to 3–4 CPM. Funding this expense weekly allows operators to replace tires strategically rather than under time pressure.
Manage Semi-Variable Costs Carefully
Some costs fluctuate based on route choices. Toll-heavy regions can add 5–10 CPM, and nightly paid parking at $25 per night can exceed $100 per week. Careful route planning and negotiated parking arrangements can save $300 to $500 per month without changing freight rates.
Insurance Cost vs. Deductible Risk
Insurance often ranges between 8 and 15 CPM for owner-operators. Higher deductibles reduce premiums but require sufficient financial reserves to cover repairs and downtime after an incident. Operators should evaluate premium savings against their ability to handle unexpected claims.
Financing Changes the Cost Structure
Truck financing alters the balance between fixed and variable costs. A $2,300 monthly payment equals 23 CPM at 10,000 miles, but rises to 29 CPM at 8,000 miles. Newer equipment may reduce maintenance costs significantly, partially offsetting the higher payment. Financing should be viewed as a tool that shifts risk between predictable payments and maintenance variability.
Weekly Financial Review and Warning Signals
Close your financial records every week. Track miles, revenue, fuel CPM, maintenance reserves, and fixed-cost coverage. Warning signs include fuel costs exceeding the eight-week average by more than 10 CPM, deadhead miles exceeding 20 percent, or maintenance expenses exceeding reserves for multiple months.
Set Your Pricing Floor and Profit Target
Your break-even rate per mile equals fixed costs divided by monthly miles plus variable costs per mile. Adding a profit target establishes your minimum acceptable rate. For example, 50 CPM in fixed costs plus 95 CPM in variable costs equals a $1.45 break-even rate. Adding a 20 CPM profit target sets a minimum rate of about $1.65 per mile.
When every cost speaks the same per-mile language, you gain clarity in negotiations, load selection, and financing decisions. With that structure in place, evaluating truck payment options and financing structures becomes far easier because you can see exactly how each choice affects your operating margins.
Where Commercial Truck Financing Fits in Your P&L
You’ve mapped revenue and translated costs into the same per-mile language. Now add the line item that often dominates owner-operator math: the truck payment. Treat it as an intentional design choice inside your profit and loss, not a necessary evil. The real question is not “Can I get approved?” but “How do the payment, the cash I tie up, and the long-run risk profile change my break-even and the stability of my income?”
Four levers shape that answer: interest rate, term length, down payment, and whether there’s a balloon or residual at the end. Rate and term set the monthly obligation and total interest. A longer term usually lowers the payment, but it stretches your exposure to market swings and pushes the note deeper into the truck’s maintenance curve. Down payment trades working capital for a smaller note; draining reserves to save a few hundred per month lowers fixed cost but increases fragility. A balloon or TRAC-style residual lowers the payment further, but shifts a lump obligation to the end, only workable if you intentionally save toward it. In P&L terms, these are choices about volatility, cash cushion, and the price you pay for predictability.
A Two-Scenario Comparison: Newer-with-Warranty vs. Older-with-Maintenance
Assume 10,000 miles per month at an average $2.25 per mile all-in rate.
Scenario A: Later-model tractor with remaining warranty
Truck payment: ~$2,200/month
Non-truck fixed overhead: $2,000/month
Variable costs (fuel, maintenance under warranty, DEF, tires): ~$0.92 per mile
Break-even calculation:
Fixed costs per mile: ($2,200 + $2,000) / 10,000 = $0.42 per mile
Break-even: $0.42 + $0.92 = ~$1.34 per mile
Scenario B: Older unit with a lower price and a shorter note
Fixed costs per mile: ($1,800 + $2,000) / 10,000 = $0.38 per mile
Break-even: $0.38 + $1.00 = ~$1.38 per mile
On paper, the cheaper payment does not automatically win. The extra variable spend can cancel much of the savings each month.
Where Older Equipment Changes the Math: Spikes and Downtime
The real difference is variance. Suppose in month 18 the older unit needs a $12,000 aftertreatment and cooling system repair and sits for five days. You avoid some variable spend while parked, but you lose roughly 2,000 miles of revenue. Net of saved operating costs, you may be out roughly $14,500 that month. Smoothed across two years, that surprise adds about $600 per month, or around $0.06 per mile, pushing Scenario B’s true break-even closer to ~$1.44 per mile. Warranty does not eliminate maintenance, but it can dampen the spikes, often the difference between predictable pay and scrambling through a bad month.
Interest, Term, and Break-Even Sensitivity
Interest sensitivity is real but usually smaller than term effects. On a 60-month loan, a rule-of-thumb is that each 1% APR shift adds about $7 per month per $10,000 financed. Finance $100,000 and a one-point move is roughly $70/month, which can nudge break-even by a couple cents per mile in low-mile months.
Term length has the larger swing. Compressing a truck into a very short payoff window can drive the payment high enough to push fixed CPM beyond what your lanes can support during seasonal lulls. Extending term keeps the per-mile hurdle manageable but increases total interest. The correct term is the one your rate cycles and miles can carry consistently, not the one that looks best in isolation.
Down Payment Strategy: Fixed Cost vs. Fragility
A larger down payment lowers the note, but it also reduces working capital. If putting $20,000 down trims the payment but leaves you thin on reserves, you have traded a small monthly win for outsized risk when repairs, slow-pay settlements, or an insurance renewal hits. Many owner-operators do better with a down payment that preserves a maintenance and downtime cushion, even if the note is slightly higher. Surviving bad weeks is more profitable than optimizing good ones.
Balloon and Residual Obligations: Lower Now, Paid Later
Balloon or TRAC residual structures can drop the monthly payment enough to fit your current lanes, but the obligation still exists. You will either refinance it, pay it in cash, or satisfy it through a sale or trade. If you choose this structure, treat the residual like a future bill and fund a sinking reserve in your per-mile model now. Your break-even will rise slightly today, but you will not face a surprise lump sum later.
The Practical Takeaway
When you slot commercial truck financing into your P&L, you are choosing a mix of fixed cost, cash cushion, and repair volatility. A newer truck with a higher note and warranty often produces a lower-variance break-even with fewer outlier months. An older truck can work, especially for mechanically capable operators with disciplined reserves, but its true cost tends to appear in spikes that the monthly payment does not warn you about. The right answer is the structure your numbers can carry through both the easy miles and the hard ones.
Now that you can see how rate, term, down payment, and end-of-term obligations shape cash flow and break-even, the next decision is how to package those levers. The structure you choose, conventional loan, TRAC lease, operating lease, or rent-to-own, determines ownership, tax treatment, and exit options as much as it determines the payment.
How to Choose Between a Loan, TRAC Lease, Operating Lease, or Rent-to-Own
When selecting how to finance a truck, you are deciding more than just the monthly payment. The structure you choose affects taxes, maintenance risk, ownership options, and how much cash remains available for reserves. The right structure places the payment where your miles and margins can support it within your overall commercial truck financing plan.
Ownership and Equity
With a loan, the truck title is typically held in your name while the lender retains a lien until the loan is paid off. Each payment builds equity, and any resale value beyond the payoff belongs to you.
With a TRAC lease or operating lease, you generally do not hold the title during the term. A TRAC lease allows you to buy the truck at a predetermined residual value or sell or return it and settle the difference. Operating leases often return the truck to the leasing company at the end of the term.
Tax Treatment and Cash Flow
Loans may allow significant depreciation deductions depending on your tax situation. Options such as Section 179 or bonus depreciation can allow large first-year write-offs, although these strategies should always be discussed with a qualified tax professional.
Lease payments are typically treated as operating expenses, making them deductible in the year they are paid. TRAC leases sometimes follow slightly different tax rules depending on contract details, so reviewing the agreement with your accountant before signing is important.
TRAC leases often show lower monthly payments because a portion of the truck’s cost sits in the residual value. However, the residual is still a real obligation at the end of the lease.
Mileage, Condition, and Flexibility
Operating leases often include mileage limits and condition standards when returning the truck. Excess mileage or wear can lead to additional fees.
TRAC leases usually avoid strict mileage caps but may require settling the difference between residual value and market value when the term ends. Loans typically have no mileage restrictions, but the owner carries full resale risk.
Maintenance Responsibility and Risk
Leasing arrangements often involve newer equipment under warranty, which helps stabilize maintenance costs. Some operating leases also offer optional maintenance programs.
Loans for older trucks often have lower monthly payments but shift maintenance responsibility fully to the owner. If choosing that route, budget higher maintenance reserves per mile to protect against downtime and repair spikes.
Early Exit and Flexibility
Loans are usually the easiest structure to exit. Owners can sell the truck or refinance as long as the remaining loan balance is paid.
Leases can include early termination penalties or restrictions on transferring the contract. Before signing, review buyout formulas, transfer options, and termination fees to ensure a change in routes or business plans does not create unexpected costs.
Choosing the right financing structure helps balance payment size, ownership goals, tax strategy, and maintenance exposure. Once the structure is clear, the next step is preparing for lender approval, understanding what underwriters evaluate and how to present your credit profile, income, reserves, and down payment effectively.
How to Build an Owner-Operator Plan That Profits in Any Market
Running a truck business means operating through freight cycles, fuel price swings, insurance changes, and evolving regulations. The financial systems you’ve built, clear revenue tracking, disciplined cost control, budgeting, coverage planning, and cash reserves, must now support a strategy that works in both strong and weak markets.
Pressure-Test Your Operation Against Market Swings
Freight markets rarely stay stable. In the past decade, national spot rates have shifted more than 10–20 percent year over year, and diesel prices have increased by more than $1 per gallon within a single season. Ask yourself a simple but critical question: if your average rate per mile drops 12 percent for two quarters and diesel increases by $0.50 per gallon, does your break-even cost per mile still stay below your lane average?
If the answer is no, adjustments are needed before those conditions appear. Reduce unnecessary fixed expenses, shift more freight toward repeat lanes or mini-dedicated routes, and use a fuel network capable of consistently saving five to ten cents per mile. Many operators also maintain a 13-week rolling cash forecast, updating it weekly. A practical reserve target is eight to twelve weeks of fixed expenses, allowing you to choose profitable loads rather than accept urgent freight out of necessity.
Align Equipment Strategy With the Next 3–5 Years
Equipment and financing decisions should match your 36–60 month operating horizon, not just the next payment cycle. Fuel efficiency, for example, is a measurable margin lever. At $4 diesel, a truck averaging 6.5 miles per gallon costs about $0.615 per mile in fuel, while 7.5 miles per gallon costs about $0.533 per mile. That difference, about $0.082 per mile, equals roughly $8,200 per year at 100,000 miles, which can significantly influence whether a payment comfortably fits your cash flow.
Insurance markets also remain tight in many states. Strong motor vehicle records, telematics systems, and higher deductibles can help reduce premiums, but only if paired with documented safety practices and sufficient financial reserves to handle potential claims.
Watch Regulatory and Equipment Trends
Regulatory changes can affect resale value, operating routes, and equipment requirements. Some states are adopting stricter emissions standards and equipment rules that influence where certain trucks can operate and how long they retain resale value. Planning the expected hold period for a truck, and monitoring possible grant or incentive programs, can help offset future upgrade costs.
Establish a Quarterly Financial Review
Create a simple financial cadence every 90 days. Update your all-in cost per mile using actual data, adjust your minimum rate per mile to preserve profit margins, and review the balance between truck payments and maintenance spending. If repairs during the last quarter approach 30 percent of the cost of a new-truck payment and downtime is increasing, run a replacement analysis before peak freight season.
Maintaining a lender-ready file can also provide flexibility. Keep recent bank statements, tax returns, settlement summaries, and insurance certificates organized so you can move quickly when a strong equipment opportunity appears.
Stress-Test the Plan Before You Need It
One habit protects trucking businesses better than almost any other: making financial decisions before pressure forces them. Run a simple stress test against your numbers. Increase fuel costs by 20 percent, reduce rate per mile by 15 percent, and include one major repair expense. Apply those conditions to your forecasted miles and reserves. If your operation still shows positive cash flow and funded reserves, your plan is built to survive real market cycles.
The goal is not to predict every change in the industry but to build a system resilient enough to handle them. When you structure financing intentionally, maintain disciplined reserves, and price loads based on real operating costs, you create a business that can withstand both strong markets and difficult ones.
Conclusion
Profit follows operators who manage the variables they can control: pricing miles above true break-even, structuring fixed costs that survive slow weeks, and maintaining reserves for repairs and downtime. When every line of your P&L is translated into cents per mile, decisions about term, rate, down payment, and residual become deliberate business tools rather than risky guesses. A practical check is to stress-test your model—lower rates, higher fuel, and one major repair—and confirm the plan still generates positive cash flow and funds reserves. If you’re evaluating equipment or financing options, review your per-mile model with a lender and tax professional so commercial truck financing supports stable cash flow while building long-term equity.
Commercial Truck Financing FAQ
What is commercial truck financing, and how does it affect cash flow, break-even costs, and equity over time?
Commercial truck financing allows drivers or fleet owners to purchase equipment through loans or leases instead of paying the full price upfront. The monthly payment becomes a fixed operating cost that increases your break-even cents per mile, directly affecting which loads remain profitable. Financing terms—such as interest rate, loan length, down payment, and any balloon payment—determine both the monthly obligation and total borrowing cost. Loans gradually build ownership equity as you pay down the balance, while lease structures may trade some equity for lower or more flexible payments.
What are the differences between a loan, a TRAC lease, an operating lease, and rent-to-own for trucks?
A loan places the truck title in your name while the lender holds a lien until the balance is paid off. Each payment builds equity, and tax benefits typically come from depreciation. A TRAC lease includes a residual value at the end of the term, allowing you to purchase the truck, refinance it, or settle the difference between the residual and market value. An operating lease usually returns the truck to the leasing company at the end of the term and may include mileage limits or condition requirements. Rent-to-own agreements often require less credit approval but can carry higher total costs and fewer flexible exit options.
How do I convert my trucking revenue from gross to true net per mile, and why does it matter?
Begin with gross revenue, which includes linehaul, fuel surcharge, and accessorial charges. Subtract brokerage, dispatch, marketplace, or factoring fees along with any chargebacks to determine net-to-truck revenue. Then subtract all operating costs—fuel, maintenance, insurance, payments, and other expenses—to calculate true net income. Dividing each stage by dispatched miles produces rate per mile and true net per mile, helping you understand what remains for taxes, debt service, and owner pay. This approach allows you to price loads accurately and protect margins as markets change.
What are fixed, variable, and semi-variable costs in trucking, and how should I organize them?
Fixed costs remain consistent regardless of mileage and typically include truck payments, insurance, permits, ELD subscriptions, and parking. Variable costs scale with mileage and include fuel, DEF, maintenance, tires, and mileage-based tolls. Semi-variable costs depend on route choices or operating conditions, such as toll-heavy lanes, lumper services, or paid parking. Organizing these expenses into a simple chart of accounts and converting them into cents per mile and weekly totals helps operators make clearer pricing and budgeting decisions.
How do payment size, interest rate, term length, down payment, and balloons shape monthly obligations and risk?
The easiest way to evaluate financing is to convert payments into cents per mile. For example, a $2,300 monthly payment equals about 23 cents per mile at 10,000 miles but nearly 29 cents per mile at 8,000 miles. Longer loan terms reduce the monthly payment but increase total interest and extend exposure to freight market swings. Larger down payments lower the note but reduce available cash reserves. Balloon or residual structures reduce monthly costs but require a planned reserve to handle the final payment at the end of the term.
How do fuel surcharges, fuel discounts, and fuel efficiency influence my net revenue per mile?
Fuel surcharges typically adjust with diesel prices to stabilize gross revenue, but they are not designed to generate profit. Profit opportunities often come from purchasing fuel through discount networks and operating trucks with higher fuel efficiency. For example, improved miles per gallon combined with a fuel card discount can reduce actual fuel cost per mile below what the surcharge assumes. Lane selection also matters, as freight lanes with stronger surcharge structures often maintain margins better during diesel price spikes.
What practical methods help fund maintenance and tire reserves, and how does truck age change the plan?
Maintenance reserves should be based on equipment age. Newer trucks under warranty may require about 8–10 cents per mile in maintenance reserves, while mid-age equipment may require 12–15 cents per mile. Older trucks often require 18–25 cents per mile due to increased repair frequency. Tires should be treated as a planned expense, typically funded at around 3–4 cents per mile to account for replacement and service costs. Contributing to these reserves weekly prevents repairs or tire replacements from disrupting cash flow.
What are common pitfalls in truck financing, and how can I avoid them?
One common mistake is choosing financing based only on approval or the lowest monthly payment without calculating per-mile costs. Payments that seem affordable can push break-even rates above what your freight lanes consistently pay. Another risk is draining cash reserves to lower a monthly payment, leaving insufficient funds for repairs or slow-paying customers. Always review contracts carefully for prepayment penalties, add-on fees, insurance requirements, and equipment monitoring conditions, and include these costs in your financial plan.
How can I stress-test my trucking finances against rate drops, fuel spikes, and downtime?
A useful stress test models several realistic scenarios. Reduce your rate per mile by about 12–15 percent for two quarters, increase diesel costs by $0.50 per gallon or roughly 20 percent in fuel cost per mile, and add one major repair along with a week of downtime. Then evaluate whether your business remains cash-flow positive with reserves intact. Maintaining a rolling 13-week cash forecast and holding reserves equal to eight to twelve weeks of fixed expenses can help ensure you survive market volatility.
How does choosing a newer truck with a warranty compare to buying an older truck with lower payments?
A newer truck often carries a higher monthly payment but typically keeps maintenance costs lower—often around 4–6 cents per mile—and reduces downtime surprises. An older truck may save about $1,000 per month in payments but may require 10–15 cents per mile in maintenance along with increased downtime risk. Over a two-year period, those additional costs can erase much of the payment savings. The decision ultimately comes down to whether your operation benefits more from lower monthly payments or more predictable operating costs.
Summary
This article explains how to plan commercial truck financing inside a per-mile business model. It covers revenue mapping, cost architecture, financing structures, and cash-flow practices that keep break-even stable through market swings.
Convert settlements into RPM and net per mile by separating linehaul, fuel surcharge, and accessorials. Example: 9,800 miles produced $2.55 RPM, $2.41 net-to-truck, and roughly $0.16 true net after $2.25 CPM costs.
Classify expenses as fixed, variable, or semi-variable, and express each in CPM and weekly terms to set a reliable pricing floor. Example: $4,800 fixed per month equals 48 CPM at 10,000 miles but 60 CPM at 8,000.
Payment structure changes break-even: rate, term, down payment, and any residual shift fixed CPM and risk. Newer-with-warranty can reduce variance even if the note is higher, while older equipment needs larger maintenance reserves and tolerance for downtime spikes.
Compare a loan, TRAC lease, operating lease, and rent-to-own on ownership, tax treatment, mileage limits, maintenance responsibility, and exit options. TRAC and operating leases lower payments via residuals but create end-of-term obligations that must be planned and funded.
Build resilience with weekly reviews and stress tests; track fuel CPM and deadhead; keep 8–12 weeks of fixed expenses in reserves and a 13-week rolling cash forecast. Use lane mix, fuel networks, and deductible strategy to keep break-even below your lane average.
Tip: Convert the truck payment to CPM and include it in your minimum rate so financing choices align with real operating margins.